WPP – slowing growth progressively reflected in rating, but are markets now also anticipating a recession?

Following Friday’s results from WPP, there are 3 areas of interest to me as a potential investor, and ones where the GrowthRater model and sensitivity analysis can offer insight on; at least on the latter two.
1. The immediate forecast
2. The longer term growth outlook and therefore rating
3. The volatility or valuation risk on this
For 1. – (immediate forecasts) , there’s probably not a great deal of variation out there in terms of the consensus forecasts that were revised after yesterday’s results. We have guidance on organic net income, fx and acquisition impact to get to a net sales number for FY17 with a variation in estimates at this stage of probably under +/- 1%. On this, guidance on EBITA margins (+30bps, +/- a little for fx, acqs and marginal revs), interest and tax, just leaves analysts having to forecast minorities and the average share base.
For 2. – (longer term outlook and rating), things get a little more interesting, particularly following Sir Martin’s somewhat darker mood on outlook, in large part it seems due to concerns that FMCG clients will increasingly prioritise margins after the shock of Kraft Heinz’s move on Unilever.
This suggests two consequences. Firstly, the prospective slowdown in the structural rate of organic top line growth and secondly, a more muted margin upside opportunity as clients also increasingly adopt zero based budgeting disciplines. From these, one might then arrive at a prospective rate of underlying Op FCF growth tracking more closely a slowing organic top line, which in turn would also warrant a lower GrowthRating.
With an implied GrowthRating that has dropped from an historic range of approx +4-5% CAGR to nearer +3.0% (prospective fwd 3 yrs), as can be seen from the below chart, one might argue that this process might be over-done. While not out of line with the underlying trend in prospective organic net sales growth, it does however position the fwd implied GrowthRating near the lower end of my target growth range of +3-4% used in my valuation. Perhaps I have under-estimated the rate of structural decline, or maybe markets are also starting to aim off and below consensus forecasts for a potential recession. This takes me to my third area of interest, modelling the valuation sensitivity to a different macro outcome.
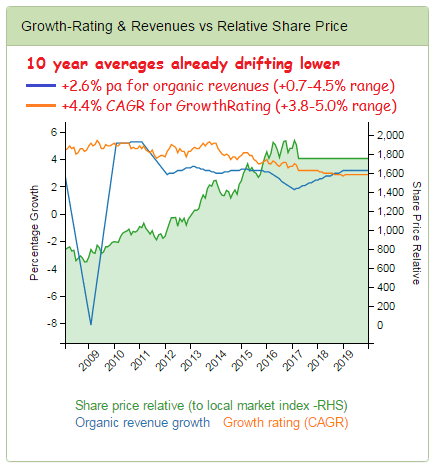
As organic sales growth erodes, so does the GrowthRating
For 3, – ( volatility & valuation risk). Consensus forecasts are probably wrong, but by how much and with what implication to the valuation is something the GrowthRater can help you with. The analysis measures margins of error for organic net sales growth as well as GrowthRating and from these can be measured the natural level of forecasting risk (or relative volatility) on the valuation. These metrics can also be taken across to the ‘Sensitivies’ module where they can be used as the basis for adjusting forecast assumptions such as for revenue growth expectations which will automatically amend forecasts and GrowthRatings to amend the valuation.
So let’s take WPP as the example and see how this runs through the module. From the extract from the table below, we can see that over the past 10 years, the margin of error on revenues on a 0.95 confidence level is at just under +/- 2ppts, which if one sets this at a 0.99 confidence level expands to just under 3ppts.
Measuring forecast volatility
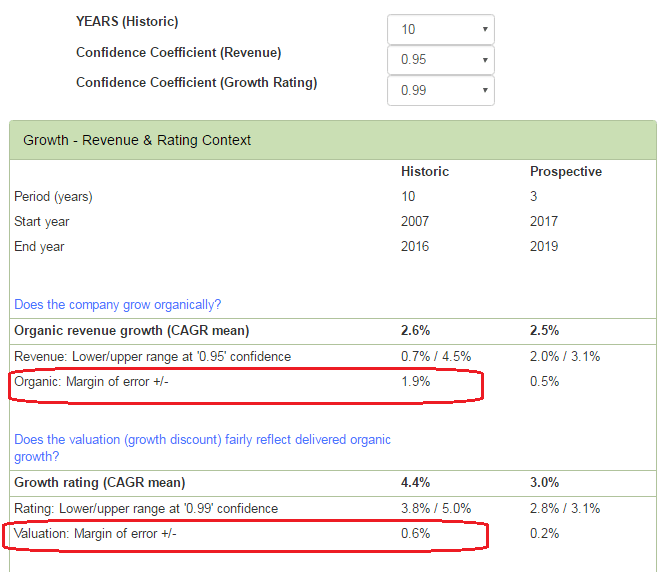
Measuring revenue and rating volatility
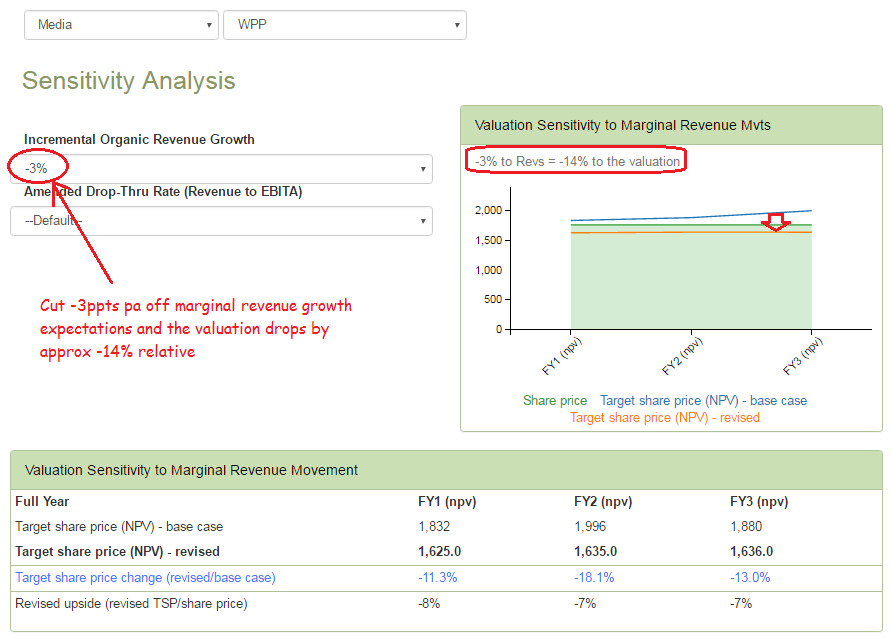
Armed with this statistical data, one can then start to flex the revenue growth assumption using the Sensitivity Analysis tab on the WebApp. In the below example I have adjusted down my base case organic revenue growth assumptions by -3ppts, while leaving the drop-thru unchanged at their 10 year trailing default rate of approx 16%. As well as re-modelling the projections for OpFCF and EV, it also adjusts where the target GrowthRating sits in the +3-4% CAGR modelling range. In this case, with FY2 organic revenue growth cut from +2.7% to -0.3%, the target rating of +3.4% on my base case forecasts drops to the bottom end of the target range ( ie +3.0% CAGR), resulting in an average reduction in valuation of approx -14% over the 3 year forecasting period. The analysis works equally well the other way and the model is easy to use in applying more radical variance in potential revenue outcomes for those wishing to anticipate more extreme environments, such as a repetition of the approx -8ppts decline in 2008. Do remember however, that these are relative valuations against the broader non-financial equity markets and a macro-led change in outlook would also tend to re-calibrate these.
Applying these changes to re-model valuations
Modelling ‘What if?’