Another non-farm payroll and another missed opportunity to normalise rates

“Silence”. That is what I hear after yesterday’s March US non-farm payroll figures. Even a few months ago, these data points, while flawed were eagerly awaited as harbingers of revisions in US Fed monetary policy. Not any more. After February’s decision to hold rates in what looks like a clumsy attempt to goose oil prices and financial markets by joining the currency wars, Yellen has gone rogue from her supposedly data dependent approach which has left markets back to picking out nuances from her every comment or from those perceived as being close to her. So now with another solid set of private sector job and wage growth after the Fed engineered rebound in oil and equity markets, we are left with the increasingly inconsistent messages from markets, administration (describing the US economy as ‘vibrant and growing’) and central banks.
One clear area of vibrancy however remains in share buybacks and other asset mis-allocations rather than reinvestment into growth or productivity. In the below table I’ve pulled out the aggregated cash conversion by reporting currency for the stock in our current coverage universe for the period 2010-2015 (inclusive). Apart for the somewhat under-whelming ratio of adjusted net income to free cash flow conversion, the main point of this is to show the investment priorities for employing this capital, with between 81% and 150% of FCF distributed back to shareholders during this period. If these ‘unconventional’ monetary experiments were expected to stimulate productive investment, then we don’t need the latest Japanese manufacturing PMI data or Vancouver house price inflation for Japan to tell us these have failed. Not that this seems to bother the unswerving central bankers who’s response to failure is merely to do the same things over and over again and expect a different result. – now what does that remind me of?
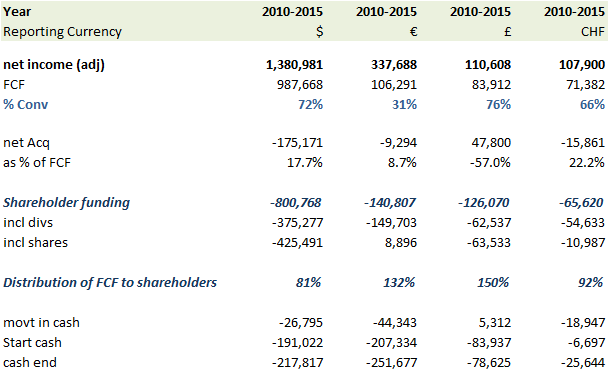
Companies are retuning between 80-150% of FCF back to shareholders (2010-2015)
The March non-farm payroll data has only a couple of interesting points to them. The first is that they represent another solid, albeit unspectacular improvement for net private sector job formation (at +195k MoM and +2.3% YoY), average wage growth (at +2.3% YoY) and total private sector incomes (at +4.3% YoY). The second it that they show another small erosion in manufacturing with a -29k contraction in MoM adds representing a deterioration in trend to an annualised decline of -2.8%. Offsetting this was the +219k MoM net adds from Service Providers (+2.1% annualised).
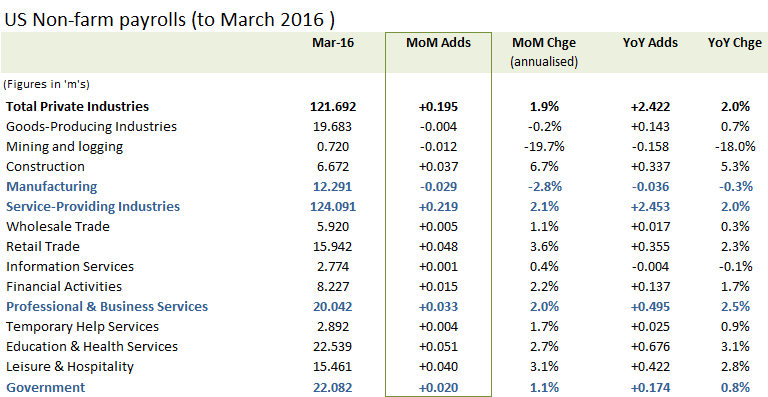
Manufacturing -29k MoM (-2.8% annualised)
Include the 7 cents up-tick in average hourly wages to $25.43 (-2 cents in Feb) and YoY average hourly wages are up by +2.3% and average wages by +2.0% after a small contraction in average hours. Extend this across the +2.3% annual increase in private secot employment and total private sector wages are up around +4.3% in March.
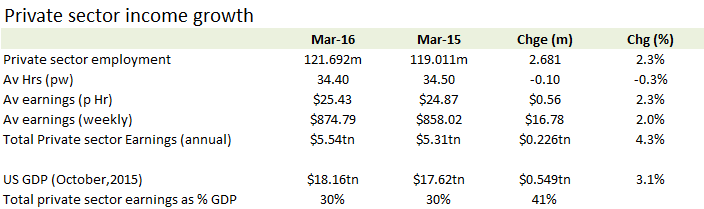
YoY Jobs +2.3%, Av wages +2.0% = total private sector income growth of +4.3%
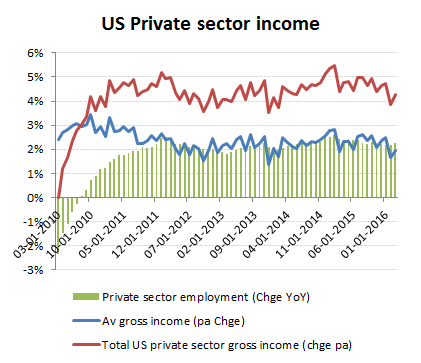
Av wages up +2.0% on +2.3% more jobs = +4.3% increase in total private sector incomes in March