IHS Markit should be the first to agree that rubbish (‘adjusted’ data) in will lead to rubbish (valuation) out

Give the market a number and it’ll quickly throw back a result. No one should doubt investors’ ability to do basic maths. Give it the wrong number however, and the result will more than likely also be wrong. The old adage of “rubbish in, rubbish out” remains as valid now as ever, which is why we only use data that we have ‘cleaned up’ and standardised. By that, I mean recognising the NPV of a group’s assets and liabilities in our EV adjustments while also recognising in our adjusted P&L data those items such as stock compensation which represent a real prospective cash call on shareholders and therefore a real cost.
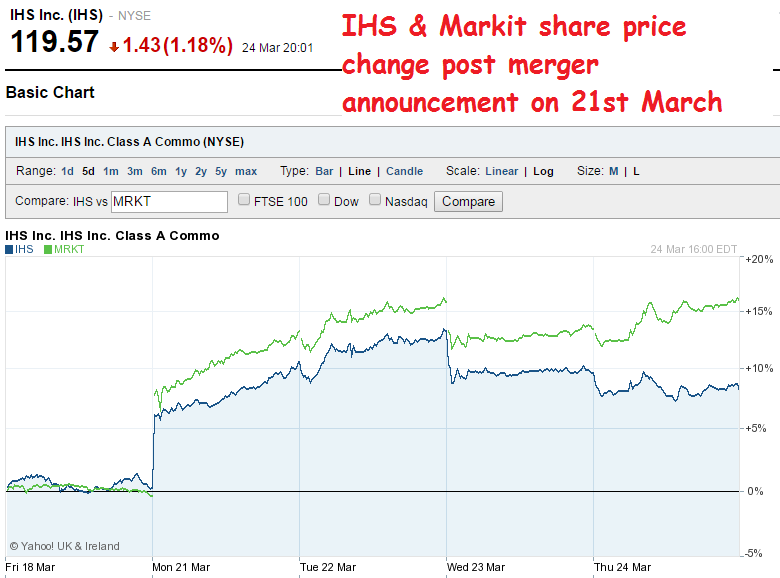
Last week’s announcement of the proposed merger between IHS and Markit reminded me of this disparity in the way markets can efficiently respond to a new data point, but be blind to the fact that the basis on which it was recalculating the effect of this was flawed. Within a few minutes of the merger announcement, markets had marked up the combined share prices by around +12%, clearly realising that the $125m pa of planned cost synergies by 2019 represented around $100m pa today, which equated to an approx. uplift in EBITA of around +10-11% on the proforma new group and approx. +12% on a pre-tax basis. This may not have attributed much value to the £100m pa of revenue synergies also planned from end 2019, although these represent a potential uplift of only around +2% against a rate of organic revenue growth that is currently running a good 2-3ppts below trend for both groups. As for the tax advantages of domiciling the new group in the UK, markets may be reserving judgement on this until either nearer the H2 2016 expected completion date or more clarification emerges on whether US tax rules will be altered in response to such tax inversions. The enthusiasm for pricing in a sizeable tax dividend at this stage may also have been discouraged by those that trawled the notes to the accounts who would have found that IHS had already not provided for US tax on $748m of undistributed overseas earnings, on the assumption that these would be indefinitely reinvested.
Give the market a cost saving number and it will quickly work out its NPV
All of the above presents a picture of market’s efficiency in pricing in an event when it’s given a new parameter. The problem with this however, is that it encourages the belief that the original basis for the valuation was arrived at with an equally reliable methodology. The problem for stocks such as IHS is that most investors are denied a reliable metric to value the group, unless they laboriously do it themselves (or get services such as ours to do it for them). There is a choice of the US statutory figures conforming to US GAAP and the company’s own ‘adjusted’ number. As GAAP numbers can include a host of sometimes arbitrary charges (including impairments and acquired goodwill amortisations) that can have little bearing on the underlying consumption of a trading asset and therefore cash flows, markets generally opt to use an adjusted number to get closer to what would represent a normalised (ie underlying) basis of earnings or free cash flow. With last year’s ‘adjusted’ EPS figure of $6.07 standing at 75% above the GAAP figure of $3.47 for IHS, this can obviously make a big difference to those using these metrics to value the business. In its description of these non-GAAP financial measures (Q4 FY15 results release: Use of Non-GAAP Financial Measures) is what seems a thoroughly reasonable comment that “we use non-GAAP measures in our operational and financial decision-making, believing that it is useful to exclude certain items in order to focus on what we deem to be a more reliable indicator of ongoing operating performance and OUR ABILITY TO GENERATE CASH FLOW FROM OPERATIONS [my emphasis]. As a result, internal management reports used during monthly operating reviews feature the Adjusted EBITDA, Adjusted net income, Adjusted EPS, and the free cash flow metrics. We also believe that investors may find non-GAAP financial measures useful for the same reasons..”.
The problem we have with this statement however, is that their definition of ‘Adjusted’ EBITDA and Cashflows does not reflect the real operating performance and more importantly cash flows from the underlying business. Anyone encouraged to base a valuation of the shares on these therefore is not going to arrive at a reliable valuation. The principal reason for this is that the group’s definition of ‘Adjusted’ excludes stock compensation costs. For many groups, stock compensation can take the form of options where the initial intrinsic value is dwarfed by the time value. While this can sometimes confuse analysts as it doesn’t entail an immediate transfer of value, the lost opportunity value represented by the conceded time value does reflect a real future cash cost to shareholders.
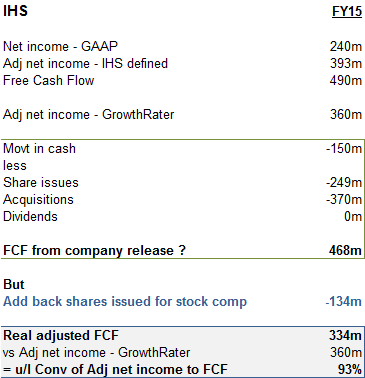
For IHS however, things are much simpler as the $135m of stock compensation is in the form of restricted stock which is awarded to employees and then bought back as part of the group’s larger share buyback programme. For those looking at the P&L and Cash Flow statements, this can be confusing as an operating item (stock compensation) is being bundled below the line into what is normally a non-trading and capital item of Share issues/buybacks. In the below table we repeat the company defined adjusted net income of $393m and FCF of $490m; an apparent conversion rate of 125%! Even using our lower adjusted net income of $360m, which includes stock compensation and working back from the movement in debt and eliminating apparent capital items, we might get to a FCF of $468m; a 130% conversion rate! Root around in the notes to the accounts however, and one can find that out of the $249m spent on share buybacks, only $100m (841k ords at $119.1ps) was spent repurchasing shares in the open market. This left 1.128m shares that were bought from somewhere else for $134m. While the notes don’t directly link these to the $135m of P&L stock compensation charges, this seems more than just coincidence, particularly when one considers that despite the approx. 1.97m shares subject to share buybacks last year, the average basic shares in issue reduced by only 287k. The implications of this is therefore that the stock compensation does indeed reflect a real and immediate cash cost to shareholders (in the form of dilution) and that adjusting for this would provide a more realistic assessment of the true adjusted FCF, which for last year we estimate was approx. $334m; a 93% conversion from our adjusted net income, but a whopping -32%/-$156m below the company’s own estimate of ‘free cash flow’. For those using our ‘Analytics’ service might feel re-assured to know that our assumed conversion ratio from adjusted net income (post stock comp) to FCF is consistent with this historic performance and taken at 95% for IHS and the new IHS Markit.
Is an operating item hiding amongst the capital categories?
So next time you feel tempted to buy a stock on the basis of its own ‘adjusted’ figures, perhaps you should check to see if we cover the stock and what our cleaned up data is indicating for earnings, OpFCF and GrowthRating.