Impending jobs squeeze, or manipulated narrative?

It’s not too difficult to identify the potential storm clouds gathering on the economic horizon, so why is it that two of the largest investment banks feel the need to state the blindingly obvious over the past week? It is not as if either Goldman’s or JP Morgan are known for their philanthropy in offering free investment insight, unless to help unwind an existing book position, or perhaps this outpouring is also part of the ongoing attempt to persuade the Fed not to be too aggressive in withdrawing the liquidity ‘punch-bowl’. More relevant will be to keep close tabs on job formation and here Elon Musk’s revelation of a planned reduction in Tesla staffing numbers of approx -10% may be a more reliable bellwether of the economic winds, albeit not yet reflected in the official US jobs data.
“You better brace yourself”, as “That hurricane is right out there down the road coming our way,” the JPMorgan Chase & Co. chief executive officer & Chairman Jamie Dimon is reported to have warned during an investor conference last week.
While avoiding the meteorological analogies, Goldman Sachs’ GS.N President and Chief Operating Officer John Waldron broadly concurred with his rival by suggesting that the current economic turmoil was one of the most challenging one he had ever faced in his career. One can only hope that this doesn’t include the “25-standard deviation moves, several days in a row” events described by Goldman’s CFO David Viniar in 2012 (referring to 2008).
Normally, corporate managers will refrain from preempting job cuts with an announcement, for all the obvious reasons, so Elon Musk’s recent warning of such a move is unusual. Perhaps he has been around bankers too much and this is an attempt to manipulate the narrative to his advantage, whether it be in getting his staff back to work at the factory/office or to head off the inevitable inflationary wage demands. But then again maybe it is just another example of Elon Musk’s sometimes weak media filter, which has got him in trouble with some in the investment community in the past.
As a bellwether for US economic activity, US private sector jobs data is one of the more reliable metrics. With weak employment protection laws, it has traditionally been an area of swing capacity and variable costs that employers have used to manage shifts in short term demand. So while managers may be talking up prospects to their bankers and investors, any slowdown in demand can quite quickly express itself in job reductions.
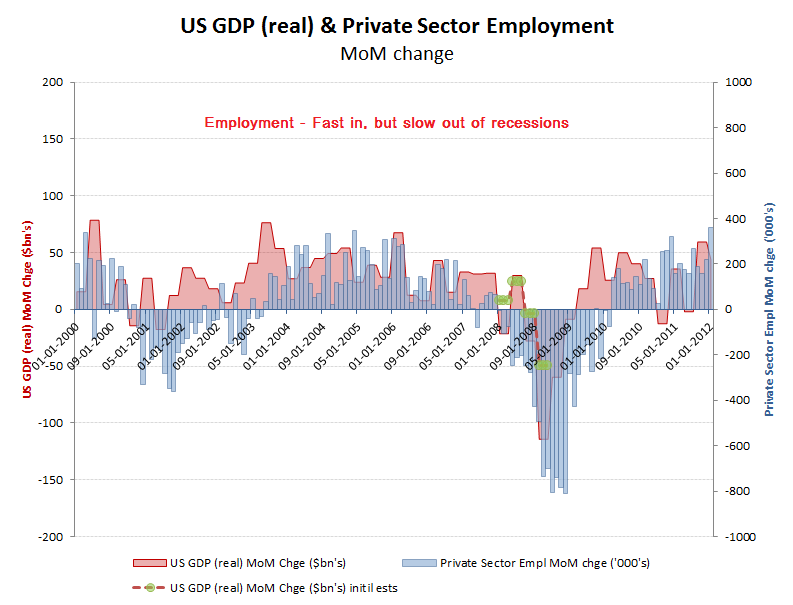
This can easily be seen from the US Bureau of Labor Statistics (BLS) data on monthly job formation (non-farm) and particularly as it relates to private sector net monthly additions. While the below chart including changes in real US GDP reflects the current estimates of growth rather than those at the time (and which I will address below), I think one can draw a few valid conclusions from the data.
- There is a consistent (100%) relationship between GDP recession and negative monthly private sector employment contractions of over -200k pm. One invariably leads and reflects the other.
- Employment is quick to be cut into recession, but slow to be rebuilt out of one.
- From the reported final GDP data, GDP and private sector growth appears co-incidental, albeit this reflects the restating of past GDP estimates by the BEA. Notwithstanding the often restatement of non-farm employment data by the BLS, this tends to be more reliable than those for GDP by the BEA. As a consequence, such as in 2008, the non-farm payroll data was reliably signalling a deepening recession from around February that year, notwithstanding initial GDP estimates that were purporting to show robust economic growth until at least the third quarter of that year.

Jobs – quick to cut, slow to restore
By February 2008, the contraction in US private sector jobs as clearly signalling recession. Regardless of what companies were saying to their bankers, investors or political representatives, they could see what was coming down the order book pipeline, or not in this case. So while public markets were being fed a diet of comfort news and expectations, mangers were busily shedding staff. Instead of listening to the narrative and what they want you to hear, watch what they are actually doing! This also applies to politicians and central banks, who at the time were desperately trying to talk up the markets and forestall a crash; and sometimes to buy time to unwind some rather nasty positions also!
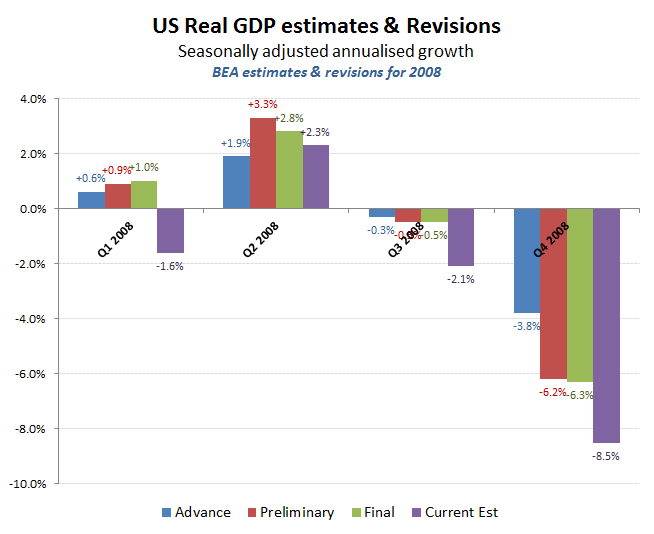
GDP was already contracting in Q1, but not recognised as such until much later!
In the below chart therefore, I have also included the initial estimates for GDP alongside the eventual outrun. What this demonstrates is the importance for getting as close to reality as possible in the data series being used. Here this would be the jobs data, which reflects what companies are actually seeing coming down their order flows, rather than the official narratives, including GDP data and quarterly results and investor communications/guidance.
Rely on the official GDP data and you’ll get seriously wrong-footed
So after all that, what is the current jobs data telling us?
- Jobs formation is slowing, but is still positive
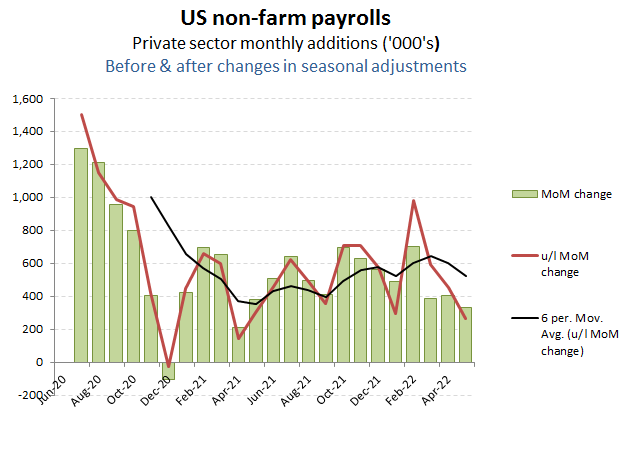
Private sector was still adding net jobs in May
By industry, the May jobs report are fairly unremarkable, albeit with some areas of concern
- Growth in ‘Mining & Logging’ will have been driven by the soaring gas/Oil prices and notwithstanding the current regime in DC doing their best to damage the fossil fuel industry, including denying new drilling leases on Federal land.
- Construction continues to benefit from the post CV19 lockdown bounce, although the sharp increases in fiixed rate mortgages and squeeze on disposable incomes will no doubt see this tail off into the summer.
- Manufacturing remains weak and the squeeze on Auto demand suggests a further deterioration in this trajectory
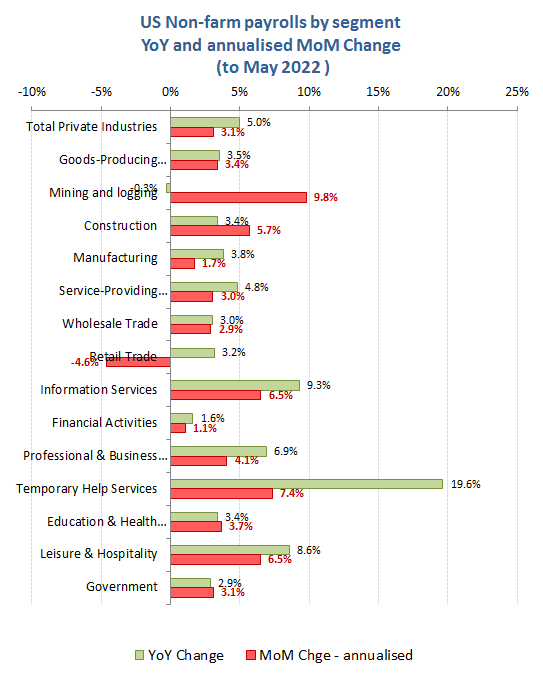
Retail and manufacturing under pressure, offset by Leisure, Construction and Temporary help
Wage inflation promises to be the contentious issue into the run up to the midterm elections as headline inflation heads up towards 10% and without a coherent policy to tackle this by either Govt or central banks. In May, the average hourly wage growth dropped back to an annualised rate of under +4%, which was under half the rate of inflation, so clearly pressures are building trouble over the next few months.
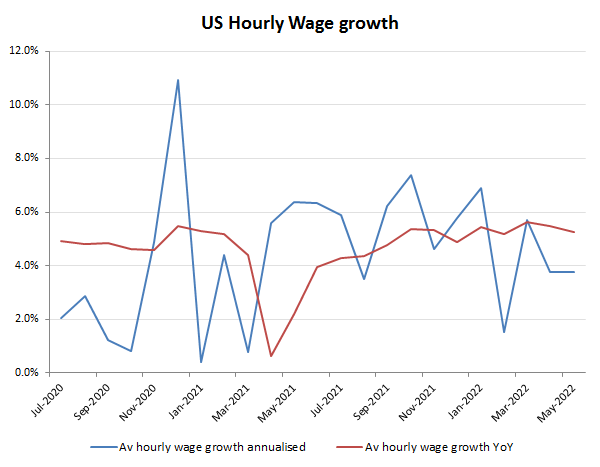
Annualised average hourly wage growth in May was under half the rate of inflation!
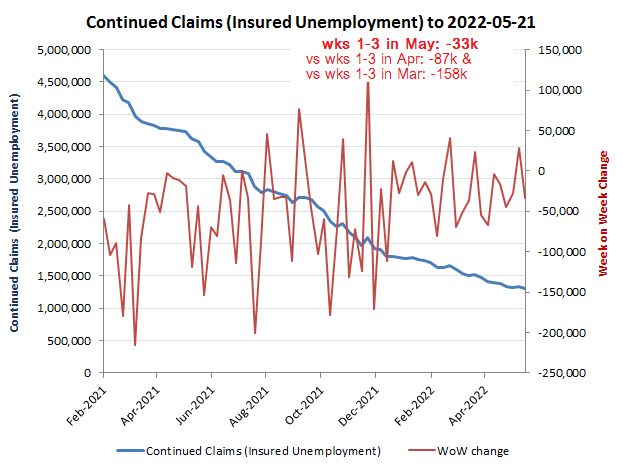
For a more granular and immediate window on the jobs market is the weekly data on insured unemployment claims, albeit subject to eligibility status and the recent distortions from CV19 lockdowns. Following the removal of most of the CV19 restrictions (and income support), improving employment demand has been reflected in reductions in the level of new claims. As with the NoN-Farm data however, the rate of employment demand is clearly slowing as can be seen by the chart below. For weeks 1-3 in the last three months, weekly claims reduced by -158k in March, to -87k in April, but to only -33k for the first thee weeks of May (the most recent data). What that suggests, is a trajectory that is soon to go positive for new claims and therefore negative for net job growth.
xxxx