Can you guess the new addition to the GrowthRater portfolio?

Can you guess the stock?
Okay, I think you’ve all had a fairly easy ride so far following some of the GrowthRater model portfolio changes that I have posted on this blog, so now you’ll have to do a little work to guess my new position. Just to remind you of some of the positions closed over the last six months have been:
- 15 October 2016: eBay closed for a +30% gain over 6 months (+28% relative)
- 26 December 2016: FedEx closed for a +34% gain over 9 months (+20% relative)
- 6 February 2017: IAG closed for +33% gain over 6 months (+24% relative)
- 1 February 2017: 3 Long positions added that are still being run
- Apple at $121.4 (now +12.6% to $136.7)
- PayPal at $39.8 (now +8.3% to $43.1)
- Paddy Power Betfair at 8,380p (now +3.0% to 8,635p)
So let’s see how you do identifying this one
It is comforting that markets price growth into stocks in a systematic way. This includes the way it reaches out to revert a Growthrating (and OpFCF yield) back to the market average in a direct relationship to the rate of prospective organic revenue growth delivery. These relationships and opportunities can be easily identified in the GrowthRater’s mean reversion analysis (the ‘Horizons’ tab).
Below is one such opportunity. As with many early growth cycle stocks, market leadership is sometimes conflated with an expectation for a linear progression, which often results in a market version of a ‘hissy fit’ when the underlying top line performance strays from the path. A similar experience was seen in 2011-12 and again in 2015 by the then Google (and now Alphabet), when markets pulled back valuation horizons as organic revenue growth slowed, but then were slow to recognise the temporary nature and clear valuation opportunity this represented. Not so for the GrowthRater, where the mean reversion analysis flagged these opportunities and I have included charts on these at the end of this email as a reminder.
Once again, markets seem to be falling into the same trap. Below is another leading tech stock where organic revenue growth has slowed, albeit largely a function of specific problems rather than any fundamental deterioration in the group’s market positioning or growth prospects. As the group cycles through the anniversary of these events, revenues appear to be recovering, as evidenced by Q1 FY17 guidance, which provides greater confidence that as these build, markets will again progressively reach out on the valuation horizon. The GrowthRater valuation algorithm captures and can anticipate this process and can therefore alert us prospective upside for the stock. For the below ‘mystery’ stock, what this could mean is a +30% pa relative share price outperformance over the next couple of years as the herd once again arrive late to the party.
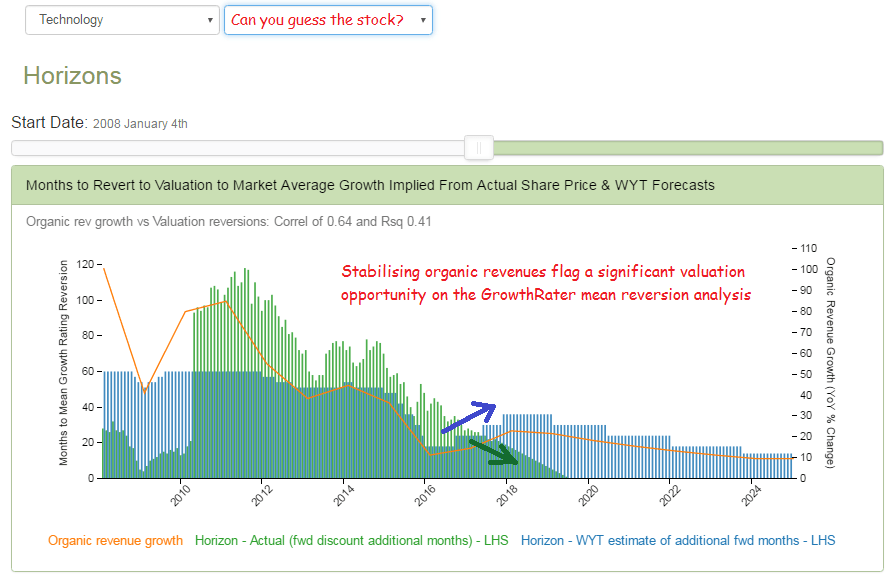
Markets missing the inflection point in the revenue recovery – again!
Applying the mean reversion algorithm to the target valuation suggests the stock price is reaching a positive inflection point and this time from a more sustainable pricing base.
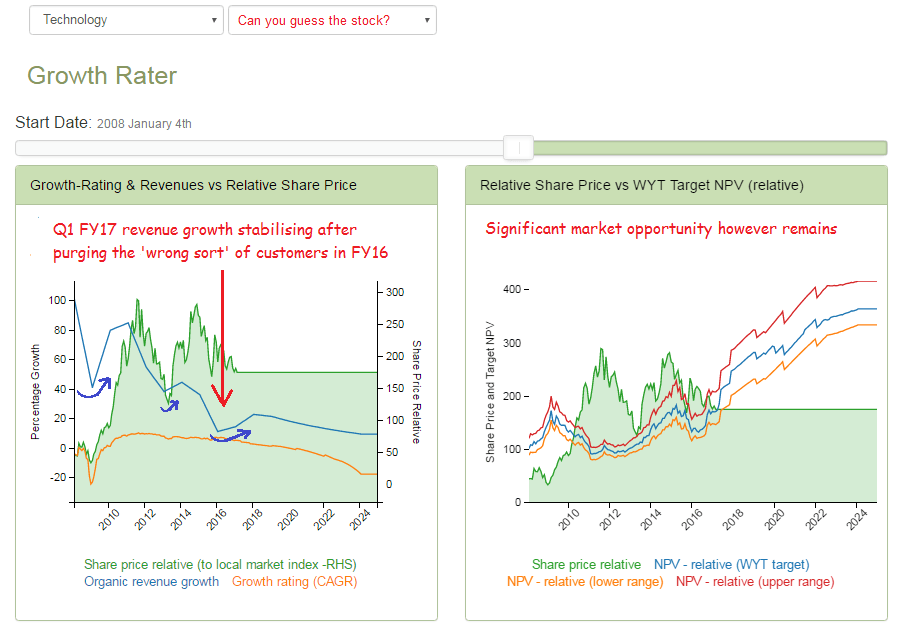
Is that a bird, a plane or the prospective share price upside?
Google/Alphabet example
Valuation horizons are sensitive to organic revenue growth expectations, which can provide for some exciting volatility in stock prices as these are amended. As with Google/Alphabet in 2011-12 and 2015, sometimes markets over-react only to subsequently get caught out by revenues stabilising. While the decline in valuation horizon is usually precipitous, with the recovery sometimes more protracted, the opportunity offered by this to investors ought to be clear.
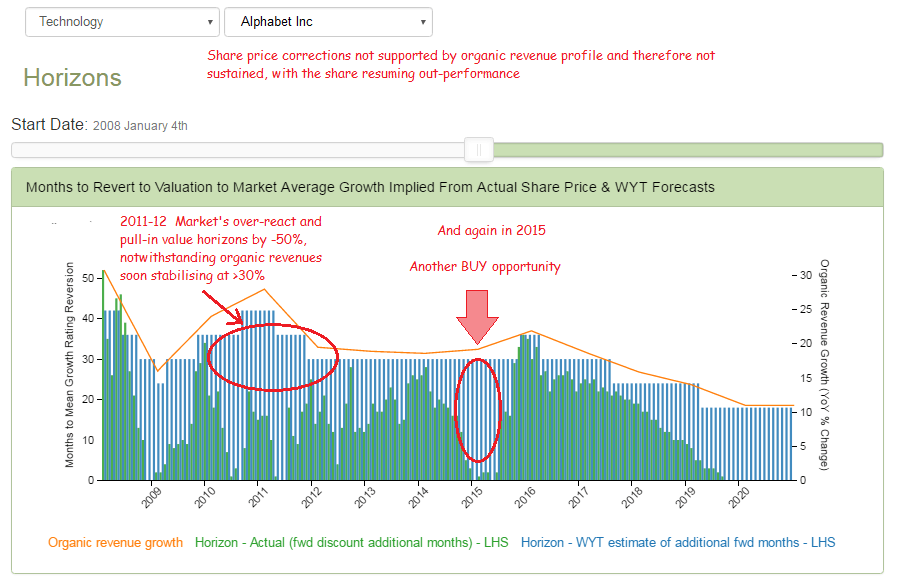
BUY points indicated in 2011-12 and again in 2015
Leave a comment if you need some help