NVIDIA – an anatomy of a valuation

Since the start of the year, NVIDIA’s stock price has trebled, while the consensus EBITDA has ‘merely’ doubled, even reaching out to FY25. While inevitably reflecting a medium term multiple expansion to bridge that gap, the actual mechanism is not some sort of opaque PEG type ratio, but the systematic relationship between growth and the valuation horizon point. As no venture can outperform in perpetuity, every valuation (OpFCF yield) must therefore also revert to the market mean and how far out that is, is a reflection of its organic revenue growth trajectory.
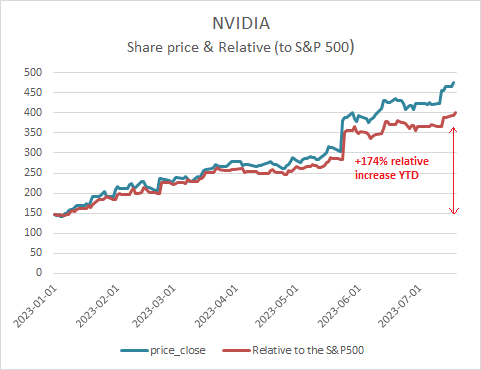
+225% YTD and +174% Relative to the S&P 500
A +174% relative stock price gain since the start of the year compares with a consensus forecast out to FY25 that has increased by +50% for revenues and +100% for EBITDA on surging expected demand for GPU’s from AI.
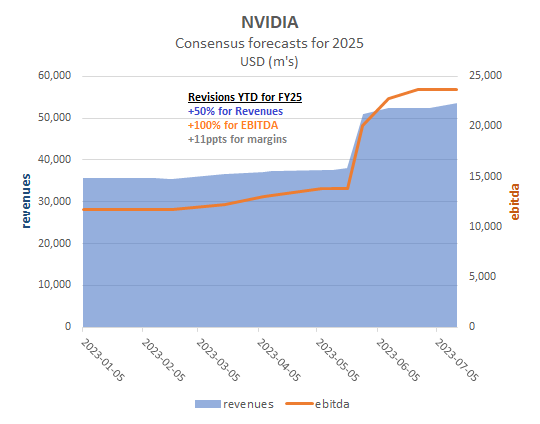
Consensus forecasts YTD for 2025 are up +50% for revenues and +100% for EBITDA
A feature of the GrowthRater algorithm is its recognition of the systematic relationship between organic sales growth and the valuation horizon point, with markets prepared to reach out further into the future as the organic sales trajectory improves.
In the below chart, is the forward reach (in months) implied from past performance of the stock price (in green) together with the projected level generated by the GrowthRater algorithm .
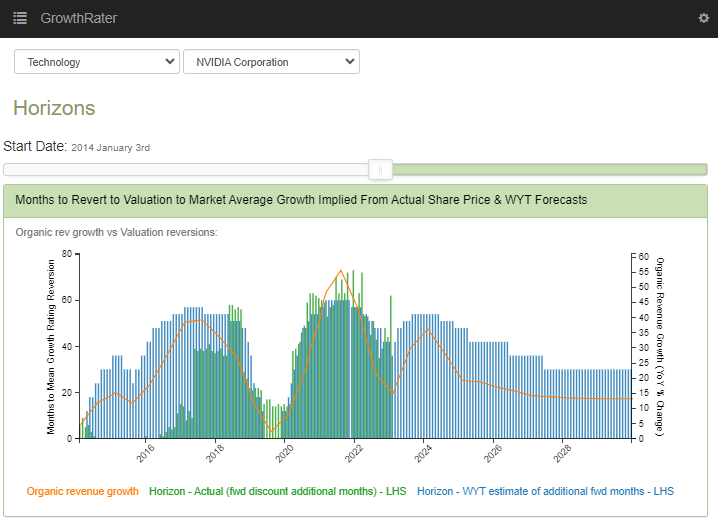
See the pattern?
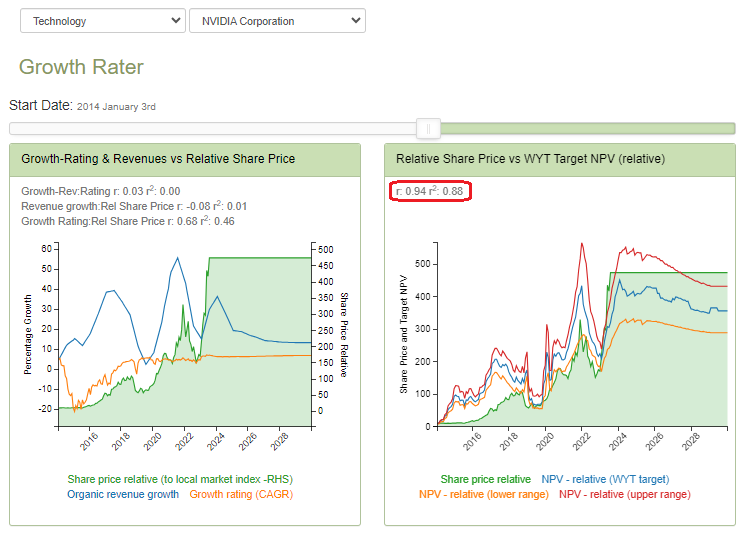
Modelling this into a target NPV for the relative stock price, together with an upper and lower range to reflect the inherent margin of error from revenue and valuation volatility trends for the company, can be seen below. The correlation of this with the actual outrun for the stock of 0.94, with an RSq of 0.88 confirms the statistical significance of this relationship
A reliable predictive valuation tool
As seen by the substantial upward revision for forecasts already this year, the denominator remains a key variable and one clearly with a high level of error margin.
Transparency of assumptions therefore remains paramount and to put the valuation into proper context. In the below charts, one can seen that the valuation within the GrowthRater is currently trailing the consensus for FY25 by approx 10-15% on both revenues and EBITDA. Perhaps by coincidence, this variance is broadly comparable to the company’s historic range for the margin of error on revenues, which can also be found in the GrowthRater tab within the WebApp (Analytics).
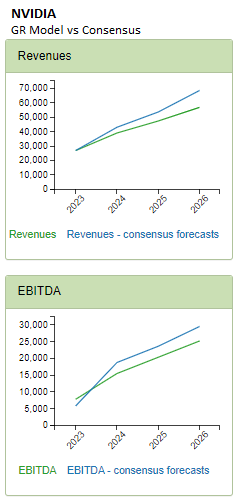
Consensus approx +10-15% ahead of GrowthRater estimates for FY25
What if?
Measuring volatility of outcomes, both on company trading as well as from market valuation remains one of the key features of the GrowthRater analytics tool kit and below is an example of using this to re-model NVIDIA’s valuation.
In the below chart and table, is a screen-shot of the ‘Sensitivity Analysis’ tool in action.
Here, I have flexed the sales growth with an incremental +10ppts of revenues (bringing my numbers up to the current consensus) which has been dropped thru the model to revalue the target NPV with a +33% upward revision.
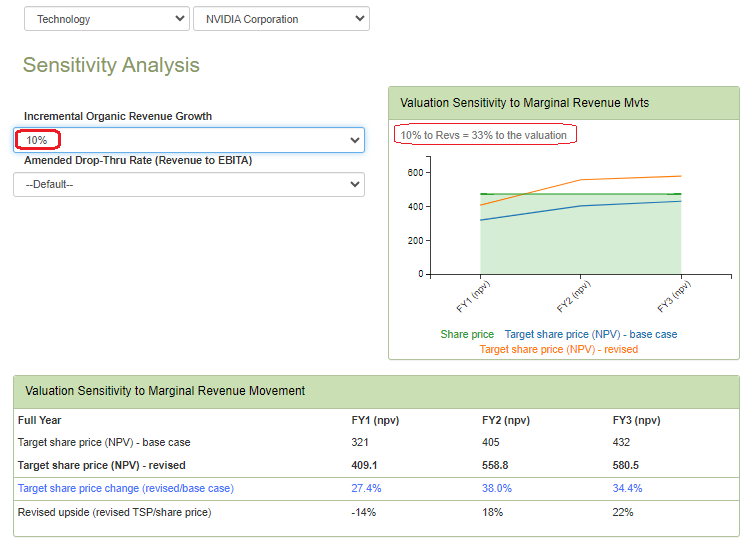
+10ppts of marginal revenues = approx +33% to valuation