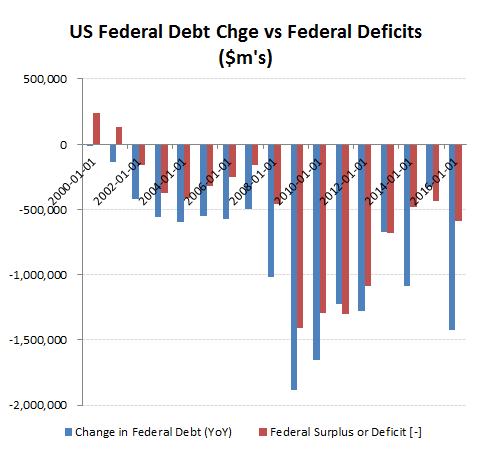
US reported Federal deficit of -$587bn dwarfed by cash deficit of over -$1.4tn

If you haven’t noticed, there is an entire industry of well funded professional spin doctors out there whose business is to present their clients performance in the very best possible light. Whether those clients are corporates trying to game an advantageous cost of capital or a Government claiming to be able to walk on economic water, investors are best served by assuming the worst until they can prove otherwise. While following the cash is not foolproof, it can at least provide an initial red flag when the numbers don’t reconcile. This might seem obvious, but there has been no shortage of insolvent companies where movements in cash failed to reconcile with the earnings or cash flow statements and were missed by highly paid ‘professionals’. Does anyone remember Polly Peck?
The same would seem to apply to US Federal Government deficits. After last year’s reduction to an official -$439bn (and only 2.3% of GDP), the outgoing President seemed poised to passed the baton to a party colleague on a tailwind of a successful economic management after the 2008 financial crisis. True, the fiscal 2016 deficit estimate released at the end of last week has seen this increase to -$587bn, although this is still only approx 3.2% of GDP; hardly a catastrophe given the state of European government financing and the current super-low interest rates.
Unfortunately, this economic miracle loses some of its lustre when you start to follow the cash. The official deficit may have been under -$600m, but the Federal Government still needed to borrow an additional $1.4tn of debt last year, of which around $400bn was bought in house by the Federal Reserve. As with many companies ‘adjusted’ earnings (or EBBS – earnings before the bad stuff), it seems that a few items may have been left out of the calculation! Looking at the spiralling Federal debt since 2008, which has increased by over $9.5tn to almost $20tn. For those that haven’t noticed, that is well over double the increase in annual GDP over the same period. For fiscal 2016 meanwhile, the +$1.4tn of additional debt equated to almost 8% of GDP. With GDP growth in the first half of 2016 running at only around +1%, this doesn’t suggest much of a multiplier effect from all this central government largesse!
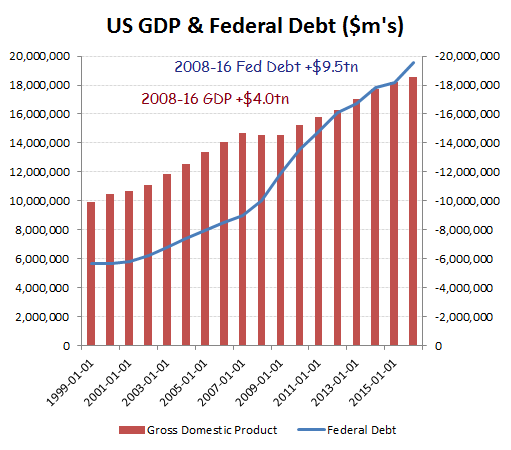
Federal Debt now approaching $20tn
Even if one were to average FY 2015 & 2016 together, it would still suggest a cash deficit averaging around -$723bn pa
Lies, damn lies and Govt statistics!
As a proportion of GDP, the cash deficit of 7.7% in FY16 would still be approaching 5% of GDP even if averaging the two year performance along with the lower figure for FY15.
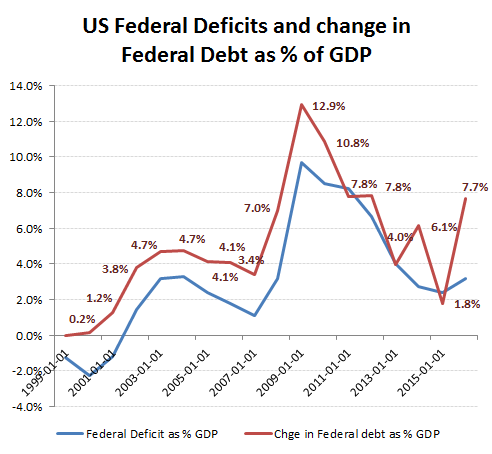
The real Federal Govt cash deficit was over 7% of GDP last year!
Yes, time for that “show me the money” clip again!