Looking beyond central bank interference in equity valuations

Behind the incessant background noise of Yellen’s ‘will she won’t she raise rates’ discussion, the closing of the Q1 results season provides a good opportunity to take stock of the broader earnings and more importantly OpFCF yield basis on which equities are priced. Relative to expectations at the start of the year, there have been winners (online players such as such as Google, eBay, Facebook and Amazon) and there have been losers (most UK consumer facing activities and those exposed to commodities and Chinese conspicuous consumption such as Hong Kong and Macau). Central Bank (CB) pump priming meanwhile has also been a contributing factor behind some spectacular rebounds in certain commodities (rebar and oil), albeit beginning to look somewhat overstretched recently. Amongst the continued share buybacks spawned of CB financial repression has been further corporate consolidations. Attempted, but largely failed ones for European mobile operators, but an increasing pace within the Agro chemicals space as Bayer attempts to follow Dow Du Pont with its own move to absorb Monsanto.
While all of these have been covered by us in our individual investment commentaries which can be found in our Analytics sections (https://app.growthrater.com/), the later offer includes an additional dimension which highlights the increasingly corrosive effects on market pricing by CB interference. That is the possibility that the ECB could end up directly bank-rolling Bayer’s proposed purchase of Monsanto under the terms of its CSPP, or corporate bond buying program, whereby the ECB can buy bonds issued by companies that are based in the euro area, have an investment-grade rating and are not banks, provided that they are denominated in euros and meet certain technical requirements. As Zerohedge aptly described it three days ago with its article “Monetary Lunacy: The ECB Could End Up Funding Bayer’s Purchase Of Monsanto (http://www.zerohedge.com/news/2016-05-25/monetary-lunacy-ecb-could-end-funding-bayers-purchase-monsanto), this would make ECB liquidity recycled into Southern European sub-prime auto loans to buy German cars seem a minor market distortion by comparison. With the bid likely to rise from its current $62bn and 75% to be paid for in cash, this means Bayer may need to issue over $46bn of debt. How very nice to have Super Mario help you to fund such cost synergy deals (ie firing employess) with super-low ECB interest rates that are back-stopped by EU tax payers! With such direct commercial participation, how long also before GM foods get into Europe through the Bayer back door?
If you’ve lost sight of where market valuations are currently standing, let’s help.
While you may have seen some aggregated PE projections for the market, these may not be on a consistent scope and definition given the propensity of many US tech groups to exclude the very real costs of stock compensation from their adjusted earnings. Our adjusted earnings however are constructed from a consistent definition, which excludes amortised acquired goodwill and exceptional items, but includes those stock compensation items. While our coverage in not all encompassing, we would estimate that with an aggregated revenue base of over $6tn and market capitalisation in excess of $7tn, it does provide a useful representative sample of non-financials. On this basis we estimate a 2016 prospective PER of approx 18.2x, dropping to around 17.5x excluding our Oil & Gas majors. More meaningful however, we estimate the market is standing on a normalised operating free cash flow yield of 4.8%, rising to 5.0% excluding Oil & Gas.
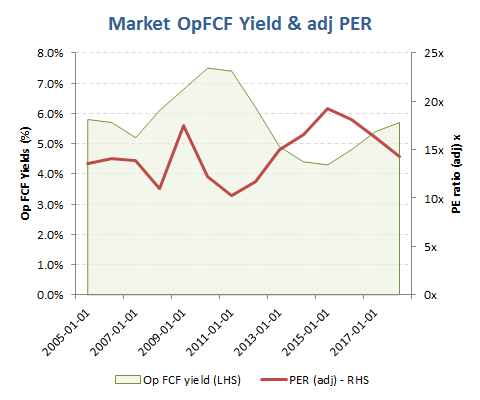
OpFCF yield of 4.8% for 2016 with adj PER of 18.2x
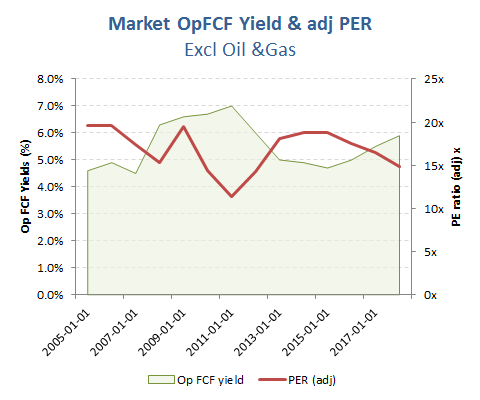
Excl Oil & Gas, 2016 Market OpFCF yield of 5.0% with adj PER of 17.5x
So what does this mean?
Well not a lot until you start to punch in some assumptions for future risk free returns and this is where those mischievous CB’s come in again. There are two ways of looking at risk free returns, normally taken from a long government bond yield. You can include along with a longer term market/GDP growth assumption of say +2% pa at constant prices the actual long bond yield and implied inflation rate from the gap between the fixed and indexed linked versions. To do this at current rates, with the 30 year indexed linked gilt at approx -0.7% and fixed at only 2.7% would firstly imply an inflation rate of around +3.4% pa is currently being priced in by markets. This means that on a +2% real growth rate, the nominal growth of the market is +5.4% pa, which with the operating FCF yield of 4.8% suggests an equity cost of capital of approx 10.2%. Take away the long bond yield of 2.7%, this would suggest an equity risk premium at an historically astronomical 7.5%; over double the rate twenty years ago, notwithstanding a comparable overall ECC. On this basis, risk assets such as equities would seem to be a no-brainer for investors, but then this is exactly the game that CB’s are trying to play. Markets fortunately are not entirely dumb and can spot a rigged game in a dodgy casino and will aim off accordingly.
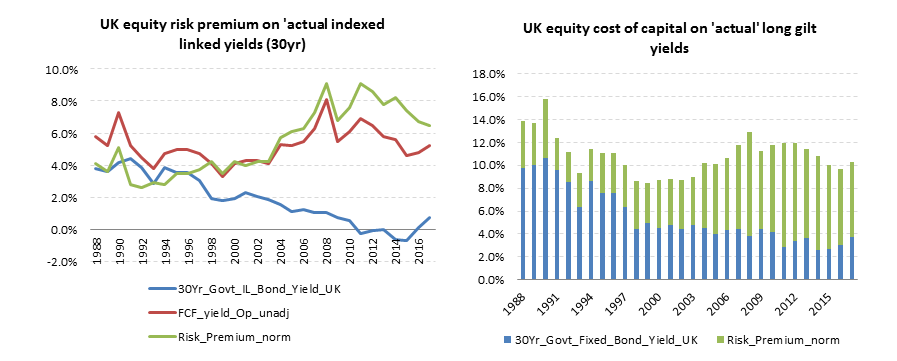
On actual Gilt yields the equity risk premium is above 7%
Market ECC has been slow to decline in the face of unprecedented CB monetary interventions aimed to drive investors up the risk curve because the appreciation firstly that this rigged game is not sustainable and also that it includes within itself the seeds of its own demise. What was initially sold as a temporary liquidity fix has become a substitute for solvency as we again pretend to be able to borrow our way out of debt. CB’s may be able to distort bond yields by buying in their own debt with newly minted fiat cash/credit, but while budget deficits ever expand as the underlying economy fails to reach the much promised ‘escape velocity’, markets know that it is just a matter of time before something gives; either a currency crisis (or series of them as most CBs are playing this game) and/or a return to long run real interest rates of 1.5-2.5%. Markets therefore have been aiming off for two probable eventualities, the impact of a return to normality for interest rates and risk free returns as well as the economic consequences of such an event. As governments have used their CB’s to dig ever deeper credit holes for themselves while squandering any pretext at honest fiscal planning, the consequences of an even modest rate rise on the tens of trillions of dollars of new credit issuance on consumption and therefore company profits and earnings doesn’t bear thinking about, or at least that is what peddlers of the ‘recovery’ fiction don’t want investors to concern themselves with.
So what sort of earnings contraction might markets be bracing for?
While history rarely repeats itself, the last reversal in 2008/09 provides the closest template for this. The circa -50% drop in total earnings including Financials and an ancillary charges over this period however may not be that representative. On the GrowthRater coverage universe, we estimate an underlying earnings contraction from 2007 to 2009 of around a third. This is what happens when organic revenues contract by around -15% and EBITA margins drop by -15%/-210bps (from 13.5% to 11.4%) on a debt to EBITA ratio of around 2x. This however assumes flat interest rates, whereas this time around one might need to add 2-4ppts to the current super-normal low rates which would take this earning contraction to probably over -35%
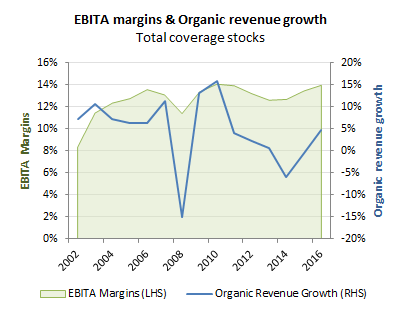
GrowthRater Coverage EBITA margins and Org Rev growth
Okay, so the market’s not dumb and is probably on top of these possibilities and indeed has already been adjusting its market valuations accordingly, possibly much to the frustration of CBs. So what sort of market equity risk premium could we really be looking at? In the below charts we have modelled the market’s implied ECC and ERP by firstly applying an indexed link yield normalised at 1.5% for the last decade with the fixed long Gilt yield at 4.5% on a +3% pa inflation assumption (slightly less than that implied by current bond pricing). Overlaying this we have then cut a third from our 2016-17 earnings forecasts (-13ppts from 2016 and the remaining -20pts from 2017). As can be seen from the below charts, the impact would be quite pronounced with the 2017 operating FCF yield on our coverage universe dropping from 5.2% to 3.6% while the ERP would compress from 6.9% to only 3.9% with the overall ECC slipping to those heady day lows at the turn of the millennium at just over 8%. Make that another -50% earnings peak to trough earnings compression and the OpFCF yield would drop to 2.9% for 2017 with an ERP down to 3.4%. Not necessarily the no-brainer suggested by the more consensus and CB driven construct!
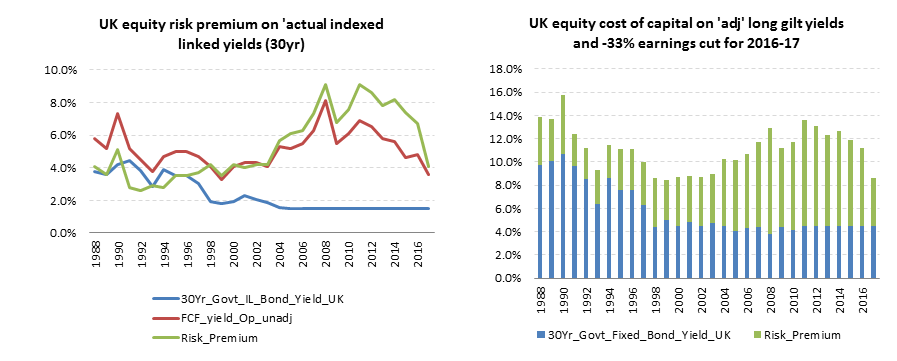
Impact of normalised IL yield of 1.5% and a -33% earnings reversal in 2016-17