Q1 GDP – too good?

Better than expected Q1 GDP growth in both China and the US, may not be as positive for asset prices as the initial market reaction might suggest. Not only does it dispel some of the more ambitious hopes for additional fiscal and monetary stimulus, but it also serves to encourage each side to dig in for greater concessions in their current trade dispute and thereby further defer a potential agreement. Remove the punchbowl, defer the trade pact and markets are back to seeking solace from current trading, which unfortunately isn’t as hot as the headline statistics might have us believe.

For those of us slogging it out in the trenches going through the deluge of Q1 company results, ‘better than expected’ might not be how we would describe the experience. ‘As bad as feared’ would be a better description, while expectations for the often guided H2 improvements seem more based on vague aspirations for a future macro-economic pick up rather than much that was tangible. Amongst the consumer discretionary stocks, there were some bright points, such as the continued surging sales of cosmetics and beauty treatments to Asia, but the performances across big ticket items such as autos and much of retail, media and telecoms, with the exception of big Tech and Amazon, were muted. While the threat to end the US sanctions waiver on Iranian oil kept the oil price up, and therefore eased some of the upstream headwinds being faced by the oil majors, the still elevated cost of oil also meant higher feedstock prices for much of the basic chemical industry. With limited pricing power and weak end user demand (particularly if exposed to autos), this has produced some nasty margin squeezes. Many airlines and freight carriers meanwhile, also struggled with weak pricing power against rising input costs, perhaps also reflecting over capacity for years of artificially low interest rates and what may also have been ROIC thresholds that were also too low – a generic problem for all capital intensive industries coming out of MMT lunacy.
The top down data however, appeared to contradict this bottom up experience, albeit less so once one scratched the veneer from the headlines.
In China, Q1 GDP growth was reported at +6.4% vs a consensus expectation supposedly at +6.3%. Apart from being humbled at the tiny margin of error between market forecast and outcome, given the inherent volatility of the components and macro environment, one also needs to reflect on some of the artificial underpinning here. In particular, the +40%/+$340bn YoY increase in Aggregate Financing credit supply to Yuan 8.2tn ($1.2tn), This included $865bn in new loans from Chinese banks in Q1 following 5 cuts in Chinese banks reserve requirement ratios over the past year. On top of this were additional fiscal stimulus from tax cuts and infrastructure spending programmes (perhaps reflected in the +22% increase in March cement production) and a possible front end loading of exports into the US to get in ahead of any potential extension to the tariffs. While sales of iPhones may have cratered into the new year, overall Telecom equipment is reported to be up +13.6% in Q1, perhaps reflecting ramp up investment in 5G, albeit still facing considerable overseas pushback on Huawei on security issues
US Q1 GDP: +3.2% – LOL!
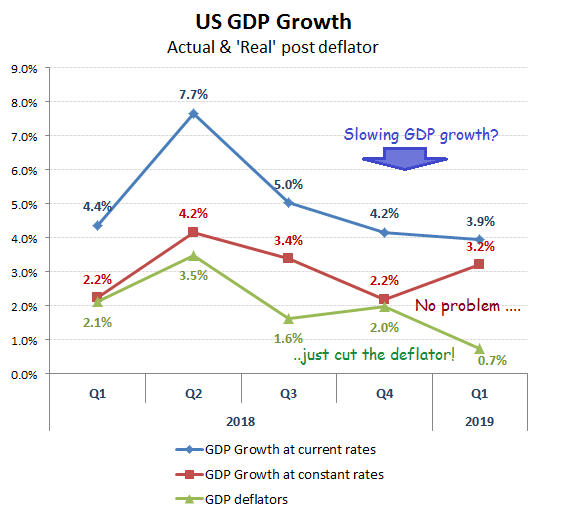
Reported ‘real’ growth up +100bps QoQ to +3.2%, but all due to deflator & Exports
If Bloomberg thinks that a strong Chinese GDP performance will help it in its current trade dispute, no doubt the US feels the same way. And hey presto, Q1 GDP growth blast ahead of the +2.3% consensus estimate and comes in at +3.2%. Now, that’s a surprise!
Before you you get too excited about this surprisingly strong performance and start to thrash around looking at Fed stimulus or the private sector employment data (a solid +219k MoM unadj in March, but a fairly limp +122k per month average during Q1), don’t bother,
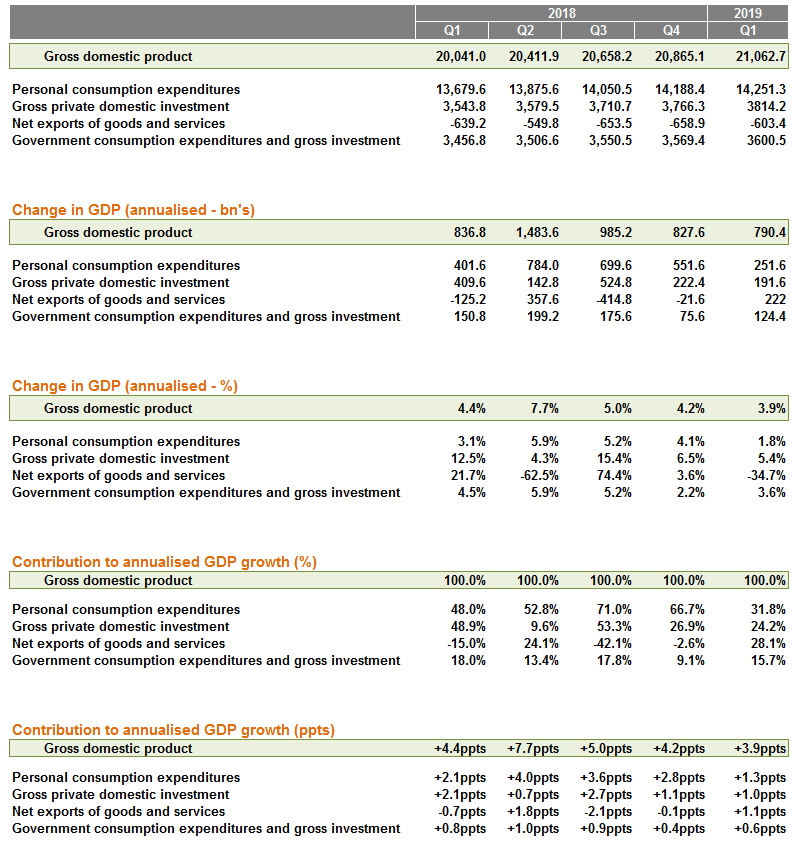
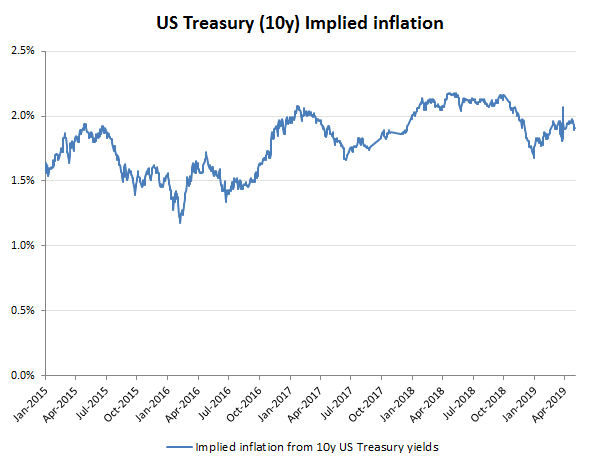
Firstly, the actual rate of GDP growth in Q1 wasn’t up on Q4, but down from +4.2% annualised to +3.9%, with the ‘real’ improvement from Q4’s +2.2% to +3.2% in Q1 simply a consequence of cutting -1.3ppts from the inflation assumption, by reducing the deflator from +2.0% to only +0.7%. That’s quite a neat trick when the YoY CPI inflation measurement was reported at +1.9% (+2.0% excl food and energy) and which was broadly in line with the inflation rate implied by 10 year Treasury yields and TIPs
The second reason meanwhile, was that +1.2ppts of the QoQ improvement in the rate of actual (at current prices) GDP growth was from the reduction in the net negative item of Exports/Imports which contributed +1.1ppts of Q1’s +3.9% current price GDP growth. Ergo, exclude this item and adjust for a more realistic inflation assumption of say +1.9% and what one should then get is a Q4 GDP advance of +2.4% real (vs +4.2% reported at current prices and then adjusting by +0.1ppts to write back the net Export drag and then apply a +1.9ppts inflation assumption) followed by a Q1 real GDP advance of only +0.9% (+3.9% reported current, then remove the +1.1ppts for net Exports and a further -1.9ppts for the deflator). I’m not sure the headline writers would be quite so enthusiastic on this, but at least it would help persuade the Fed to keep interest rates on hold!
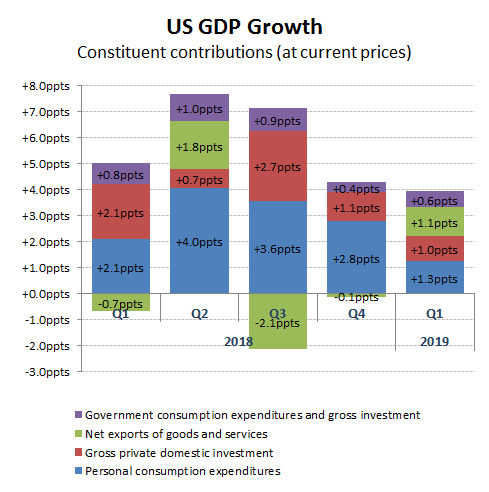
For a little additional data, the below table provides the seasonally adjusted current price numbers and the main constituent parts and contributions. Click on this link for more granular information by specific sector from the BEA