Is it a surprise that most investors lose money when they are relying on a flawed metric?

Confused?
Don’t worry, because you’re supposed to be. That way you can be sold a metric that has been anointed as the approved currency by which you are meant to determine the value of the goods or services being transacted. The fact that this currency may be flawed is fairly immaterial because it’s good for business and as long as most people believe in it, these currencies can also become self-reinforcing. When you are buying a TV audience based on a tiny extrapolated sample or even internet clicks, it is important to remember that the currency is the transaction medium and not what you are buying, which hopefully are conversions rather than empty screens and robo-clicks. For an advertiser this might seem rather obvious, but can the same be said for investors where the PE ratio is often confused with being a measurement of value?
Investors like the PE ratio because all companies report earnings, so the multiple of the share price to this is the PE ratio. How easy is that? So popular is this metric, that companies will often report many versions of it, providing investors with a pot pourri of alternative numbers to choose from. With statutory (GAAP/IFRS/RAB etc) earnings increasingly divorced from underlying company trading performance, these unregulated company defined ‘adjusted’ earnings are increasingly being adopted as benchmark figures for PE analysis, albeit resembling a financial wild west. Investors are right to be confused. Is it a surprise that most investors also lose money?
For those of you that simply can’t survive without the anchor of a PE, I’ve put a chart below of the ‘adjusted’ PE ratio of the stocks currently under coverage by the GrowthRater. As this is generated from the cleaned up historic data and our proprietary forecasts it is at least on a consistent definition, including costs such as stock compensation where often excluded by US tech stocks. As with any earnings basis however it will be blind to differing recognition policies and application of ‘exceptional’ items or liabilities parked in or off balance sheets that are not reflected through the P&L.
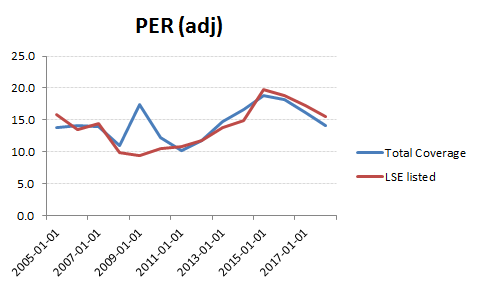
Adjusted PER on total GrowthRater coverage
As a company’s value can be defined by the NPV of its prospective free cash flow, measuring this ought to be a first step. As we want to value the trading operations clean of distortions from the capital structure and other non-operating factors we adopt a Modigliani-Miller approach and strip out the NPV of these items to arrive at an adjusted EV. With the adjusted earnings to FCF conversion records we can also determine the normalised operating free cashflows and therefore the operating free cash flow yields for the stocks along with the aggregated figure for our coverage universe. While this is focussed on non-financial sectors, the current scope consists of stocks across 10 sectors with a combined market capitalisation of over $7tn, with sales in excess of $6tn, which we feel provides a fairly representative sample. The advantage of this approach is that is also largely impervious to the differing accounting standards being used as it is measuring cash flow rather than earnings, as well of course in capturing the off P&L assets and liabilities. Valuations across regions, for what are already largely international trading entities, therefore become feasible.
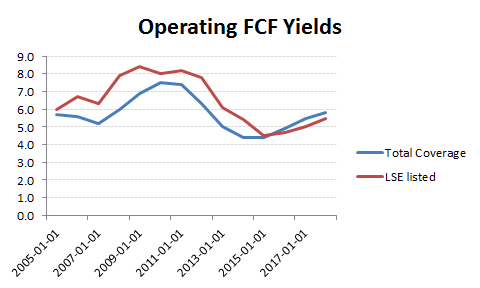
Operating FCF yields are more representative
Insight starts with clean and reliable data. Our data allows us to establish a market average Op FCF yield which provides a benchmark for calculating a proxy equity cost of capital for our non-financials (see our ‘Tutorial’ video), from which a company’s prospective growth can be deducted to arrive at a target Op FCF yield which can be grossed up to arrive at a target share price range. In essence, we are defining a company by its implied growth form its normalised Op FCF yield and juxtaposing it with the organic growth actually being and expected to be delivered. As such we are restoring the direct connection between the growth delivered by a company and the growth priced into the shares, a feature sadly missing from any earnings based metric.
With the right data, this type of analysis is not demanding and the GrowthRater will take you through the process. As an aide memoire, there are two key questions to answer on any stock. First, what is the base of normalised Op FCF and secondly what sort of growth trajectory ought one to be discounting. These will be connected as we can see what rate of conversion of earnings to FCF a company was generating for a given rate of organic revenue growth delivered. Or put another way, how much of the profits had to be reinvested back into the business to achieve the top line growth, because if we are discounting that rate of growth we need to be taking only the remainder as the free cash flow. A company may report the same operating margin and organic revenue growth as a competitor, but if it is generating half the amount of free cash because it needs more cash to fund its growth, then it’s worth half the amount. As the target Op FCF yield is a function of the EEC less the nominal growth, halving the growth does not halve the target yield, so the converse does not apply.
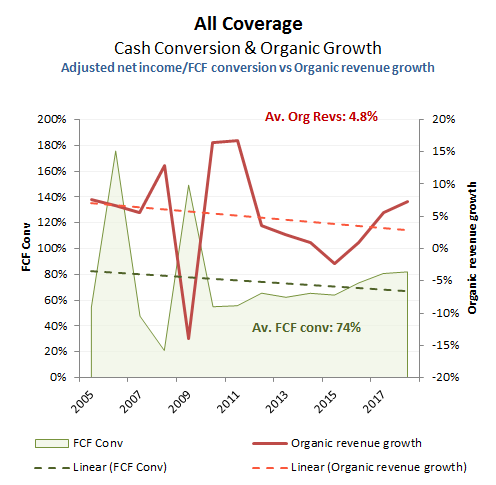
To put the implications into perspective from an earnings orientation I have added a few charts below, showing the average cash conversion and organic revenue growth rates for the GrowthRater coverage universe from 2005, together with some sectoral split outs.
Total coverage universe. A lumpy performance over the 2008/09 financial crisis on both revenues and cash conversion as perhaps might be expected, but averaging out with an average organic revenue growth of +4.8% pa and FCF conversion of 74%. A point to note would be that the pick-up in growth for the forecast end years is not a reflection of misguided optimism on global GDP recovery forecasts, but the lagged impact of stabilised oil prices on revenues for the oil majors as well as the impact of inflationary compensatory price increases across related downstream industries such as basic chemicals, airlines and transportation.
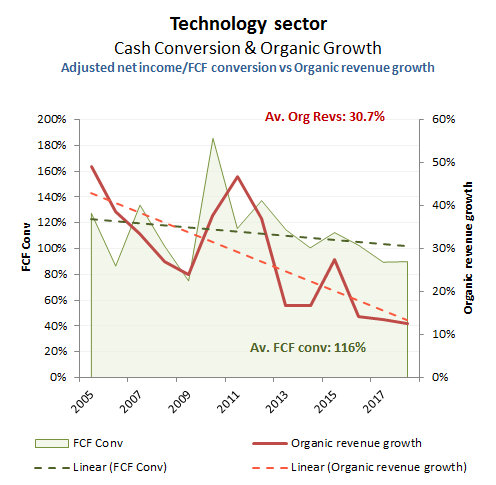
Technology
Against some country indices, our coverage universe will contain a larger proportion of higher growth technology and internet marketing groups to raise the overall growth and cash conversion averages. While the maturing of growth as some stocks move out of early growth phases (including Apple) has reduced these rates of growth over the period, organic growth is still exiting the period at over +10% pa with FCF generation at over 100%.
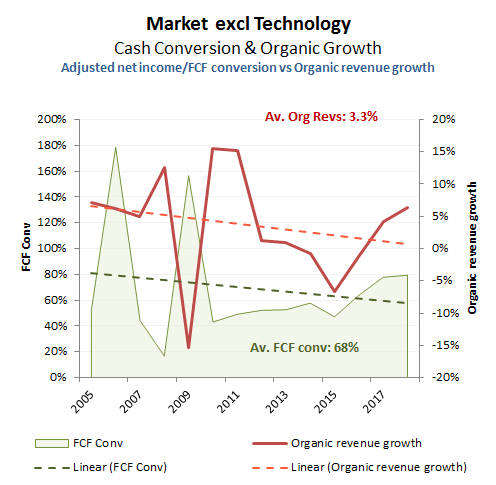
Growth focused on just a few key sectors
Excluding Technology, average organic revenue growth drops to only +3.3% pa, with FCF conversion averaging only 68%. With the recovery in oil and gas segments however, both these metrics end the period on a firmer note, with organic revenue growth hitting approx +5% and cash conversion edging towards 80%
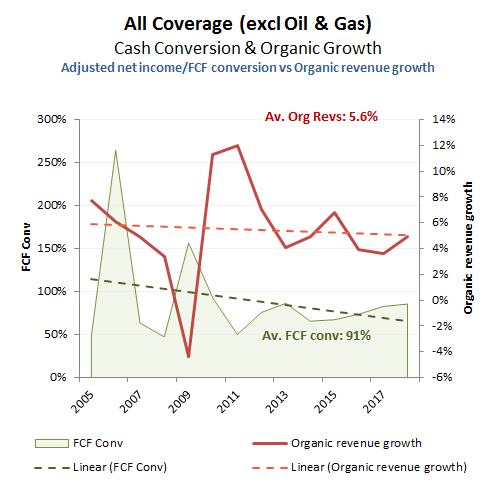
Sometimes strategists like to exclude both Oils as well as financials out of the mix. Within our coverage universe this would therefore further increase the weighting of the US tech sector component with the consequential rise in averages for growth and cash conversion. How representative this would be of the underlying position for non-financial equities however is another matter.
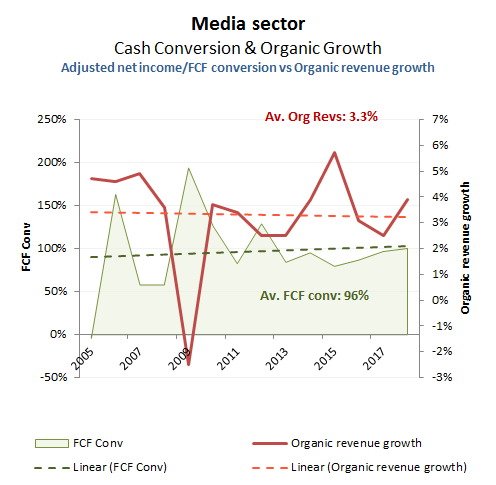
As a hitherto growth sector, Media has fallen on hard times. Cash conversion from adjusted net income to FCF remains strong as just under 100%, but the pace of average organic revenue growth has dropped back from the above +5% pa being achieved prior to 2008 to nearer +3%. While an aggregation of some fairly disparate sub sectors, this decline largely reflects the disintermediation of traditional print media to online verticals that tend to be reported amongst the Tech stocks