Tesco investors O/D on the Recovery Effervescent Powder

Back in 2013, consensus forecasts were predicting operating margins for FY14 and FY15 in excess of 5% and which in less than a couple of years had more than halved to little more than 2.2%. It is perhaps not surprising therefore that after almost -£8bn of restructuring and impairment charges across FY14 & FY15 and a £1.5bn pa cost reduction programme (approx 2.7% of sales), that markets are eager to start discounting a potential rebound in margins now that like for like sales have stabilised. Having come from over 5%, the margin target of 3.5-4.0% for FY20 therefore may seem undemanding and this is pretty much what markets now are discounting.
Assuming the upper end of this margin range (of 4.0%) would suggest a recovery in FY20 EBITA to around £2.4bn. Discount this back at the market ECC and the NPV drops to about £1.77bn. Apply a generous conversion rate of 90% to reflect the reduced rate of retail space expansion and a tax rate of 22% (currently 25%) and we’re looking at a normalised OpFCF of approx £1.24bn pa. With the shares trading at over 212p immediately following the H1 FY17 results, Tesco’s MV is around £17.3bn. Add in the debt debt of -£4.4bn, tax shield of +£0.96bn and net provisions of -£6.9bn/84p ps and we have an EV of nearer £27.6bn which therefore implies the stock is trading on a normalised OpFCF yield of just under 4.5%. Relative to a market ECC of approx 9.7%, this therefore also implies that the shares are discounting growth of around +5.2% pa (our GrowthRating).
All of this raises a couple of major questions.
- Given the volatility in past forecasts, how confident should investors be in a forecast reaching out over three years when rising input costs from lower sterling will need to be passed on to consumers in a still very uncertain competitive environment?
- Are PE based investors failing to reflect the scale of balance sheet liabilities, including the >£7bn pension deficit?
The answer to these would seem to be for 1. “not a lot” and for 2. “not at all”.
This is why you shouldn’t rely on a flawed post interest, but pre ‘the bad stuff’ metrics such as adjusted EPS and PE’s and why our methodology is superior as it will capture all of this and show you what is really being discounted by the shares. In this case, not just an uncertain future margin target, but a recovery in the growth rating to a level that might even have seemed ambitious in the days when the sector was producing growth closer to domestic consumption rather than struggling to keep pace with inflation.
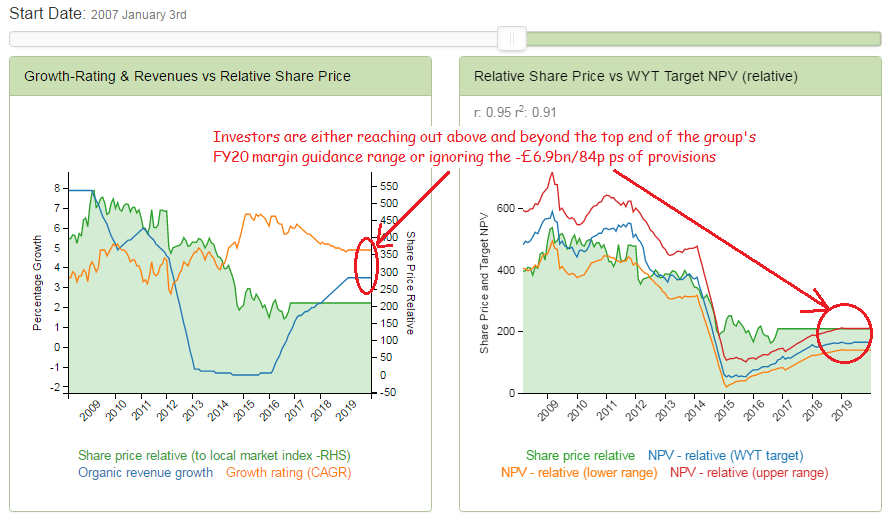
Markets anticipating >4% EBITA margins by FY20