Another US non-farm payroll report and probably another deferral of the interest rate increase

The Fed it seems is off the hook for an interest rate increase for at least another month after the May non-farm payroll number. At +38k of net additions for the month (+25k for private sector) and with March and April figures also restated down by -59k, this is hardly the escape velocity of a healthy economy capable of weathering a normalisation in rates. This however assumes that the Fed has any real intention of returning the economy to a world where markets price risk. If there had been an opportunity for the Fed to wean its owners and government off the ‘MOAR’ spice addiction of fiscal irresponsibility, then it has probably long since past. With outstanding consumer credit now back above its 2008/09 peak, US Government public debt currently up by +$1.08 trillion in the 12 months to June this year (so much for the sub $500bn annual deficit spin!) and an even longer tail risk from the unfunded liabilities, let alone the mountain of still completely unquantified and uncontrolled derivative exposures and it is not hard to see why the Fed’s room for manoeuvre is so limited. Raising rates into this would be the monetary equivalent to dropping a lighted match into a box of fireworks. The Fed needs interest rates low enough to stop existing borrowers from defaulting, but with an expectation of higher rates to come to discourage excessive further borrowing. With most other central banks still printing, talking up rates also stokes up healthy demand for the US dollar and treasuries on which this Ponzi scheme relies on. As Roosevelt would NOT say, “Speak loudly and carry a little stick”, or as Germany’s finance minister, Wolfgang Schaeuble was reported to have conceded, “When it becomes serious, you have to lie”. So when you get a set of statistics such as these May US non-farm employment numbers or the declining US auto sales for that month which would normally trigger a weak US dollar, but high equity response from MOAR and longer monetary easing, don’t be surprised if it is also accompanied by the usual well placed spin from ‘insiders’ suggesting that interest rate rises are still to be expected, just a little later than originally planned.
May’s US non-farm payroll figures
With consensus forecasts for MoM net job growth of around +200k for May dropping back to nearer +160k following the -35k strike related job losses at Verizon, the actual outrun for the month of an increase of only +38k (+25k for private sectors) as well as a restating down of the previously released numbers for March and April by -59k (from +208k to +167k for March and from +160k to +123k for April), was both a negative surprise as well as a reminder how volatile these statistics can be. As usual, there is a heavy seasonal adjustment applied to the numbers. This year, the seasonal adjustment of +332k added to the May Private sector numbers was -39k less than applied for May 2015 (of +371k) which if added back in would have taken the MoM Private sector job growth up from the reported +25k to nearer +64k; still not great, but perhaps without the (intended?) shock and awe of the original figure.
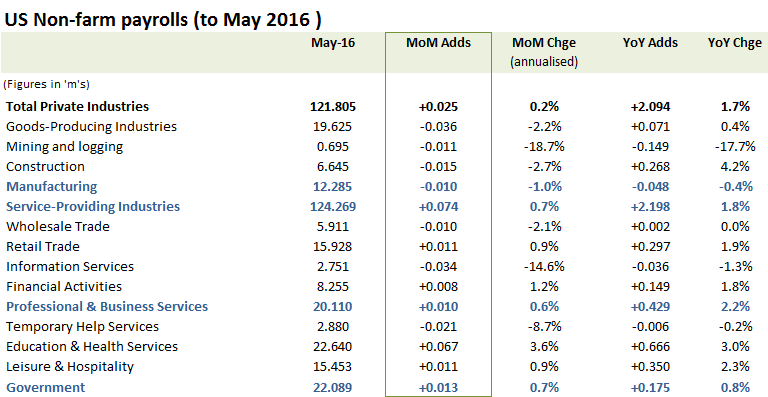
+64k MoM excluding the -39k reduction in seasonal adjustment
By sector, the May trends were directionally broadly consistent with prior months, but with the exception of Construction, which was down by -15k MoM (-2.7% annualised), in large part a consequence of its surge earlier in the year which can be in the YoY net adds of +268k still representing an increase over the year of +4.2%. Elsewhere, the pace of contraction in mining and Logging has deteriorated to -11k (-18.7% annualised vs an actual YoY decline of -17.7% in May), albeit with oil prices recovering to $45-50/bbl, rig count declines are slowing and there is even the prospect that production activity could be stabilising. With a high US dollar, manufacturing related areas remain under pressure and following the weak May auto sales figures this is unlikely to improve, although demand for bartenders and waiters remains strong as does for Healthcare workers. Notwithstanding the vibrancy of the US IT industry, this segment was flat, even after writing back in the -35k losses from Verizon, reflecting the continued offshoring of jobs to lower cost regions such as India.
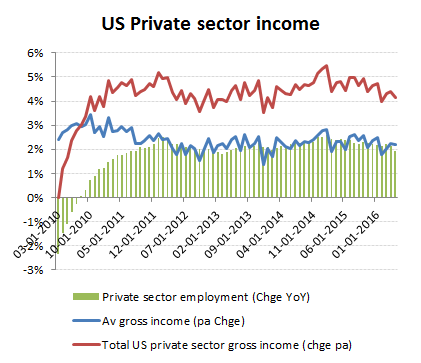
Private sector net income up +4.1% YoY, albeit an only +1.2ppts contribution to GDP
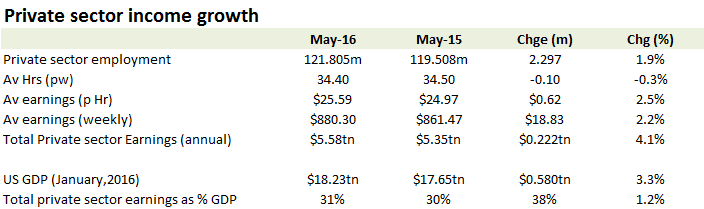
One month in isolation is not going to have that much direct effect on the annual macro numbers for earnings and contribution to GDP, albeit weakening job security will impact confidence and therefore loan demand and consumption. For May, the YoY increase in private sector employment of +1.9% is running ahead of total (official) population growth (of approx. +0.8% pa) although the shifts in age demographics (ie aging population) means that the employment participation rate has continued to decline; by -20bps both YoY and MoM from 62.8% to 62.6%. The less relevant unemployment rate meanwhile fell by -30bps from 5.0% to 4.7%. With YoY average weekly earnings up +2.2% (Av hours -0.3% with av hourly wages up +2.5%) on this +1.9% job gain, we estimate total private sector earnings are up by +4.1% YoY (to $5.58tn annualised).
Funding the American Dream
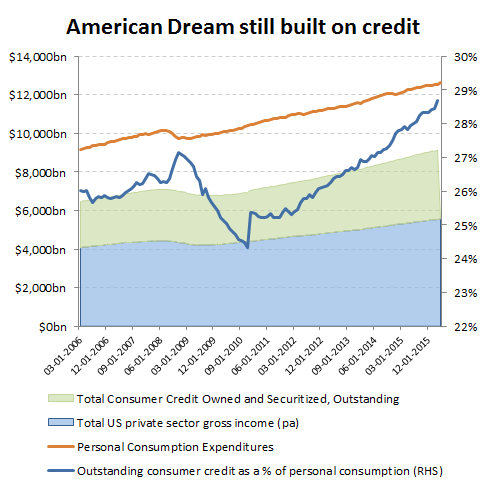
The private sector may provide the ultimate bedrock for all US consumption, but as the size of the state component to the economy expands, this reduces the direct contribution of private sector income growth to overall US personal consumption. At $5.58tn, we estimate that private sector incomes represent only about 31% of total US GDP and 44% of the $12.65bn pa of US personal consumption which means the +4.1%/+$0.222tn annualised increase represents a direct contribution to overall US GDP growth of +1.2ppts and +1.8ppts to Personal consumption.; ie barely covering inflation as these figures are all at current prices. Since state enterprises and therefore employees are takers rather than contributors to GDP, this leaves the question of what drives the remaining 66% of US personal consumption once one strips out the 44% represented by private sector gross incomes. The two remaining areas of course are corporate tax receipts (both State and Federal) and debt, whether monetised or borrowed honestly. Corporate tax receipts however, despite the high marginal rate of US corporate tax represent a relatively small component of this. In 2015, the Office of Management and Budget estimated Federal corporate tax receipts totalled only $342bn or under 11% of total Federal tax receipts, compared to $2.54tn in income and social security/pension receipts. With State and Local corporate tax receipts representing only just over 5% of tax receipts and 2% of revenues, raising we estimate well under another $100bn from taxing corporations, we estimate the total tax take from corporates last year may have been under $450bn or <3% of GDP and <4% of Personal consumption. Strip out the underlying income generators to the economy (corporations and private sector incomes) however and one is still left with just over half of all US personal consumption unaccounted for. While tourism might provide a small net contribution and purchases of luxury properties by overseas oligarchs to hide looted wealth may provide another component, the vast majority of this will be from credit expansion, either personally or via increased government borrowing or debt monetisation. In addition to the continued >$1tn pa expansion of the Fed balance sheet, US consumers have again been lured back into a borrowing themselves a better lifestyle. In the below chart, outstanding consumer credit (of >$3.6tn) has already broken above its previous peak in 2008/09 and now stands at almost 29% of personal consumption vs just over 24% in 2010. In addition to this, one also needs to include other liabilities such as student loans (up from 0.6tn in 2008 to currently $1.35tn).
Debt can be monetised and then debased, but only so long as the reserve currency status exists
Can’t pay, won’t pay
Living beyond your means, which is exactly what the US (both consumer and government) has been doing for over a generation has only been possible because they can sell dollars to the rest of the world who had to buy them to buy oil (the petro-dollar) and other dollar priced commodities. Ultimately, bad debts are pushed up from US consumers to the government (last time is was sub-prime property, this time probably student loans and possibly sub-prime auto loans) and then that liability is monetised or sold off in an over-priced treasury bond as rates are artificially depressed. The Ponzi however only works if there remains a ready market for US dollars, which while under attack as Russia, Iran and China attempt to circumvent the petro-dollar, has been supported by the even weaker comparative currencies still pursuing unbridled QE programmes such as the Yen and Euro or credit formation atop a potentially massive corporate and property debt pile such as in China. With alternatives like these is it surprising that the Fed believes it can run with the talk tough do nothing approach a little longer?