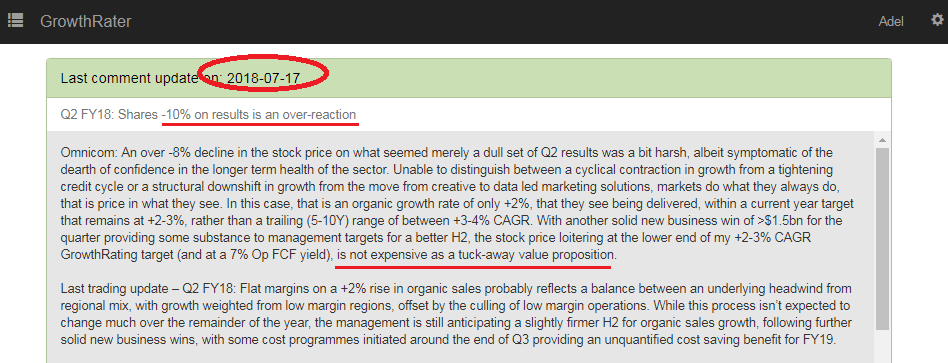
Omnicom – yes it was oversold after Q2!

After seeing its shares tumble 10% immediately following its Q2 results, I added a position in Omnicom across a couple of portfolios I manage. It wasn’t that I was won over to the structural growth story for these marketing services agencies, but more a function of two things. Firstly, there is a price for everything and second, that markets have established a consistent record of being fairly clueless in anticipating the growth that ought to be priced into this sector.
As the group delivers a solid organic sales growth performance for Q3 and reports a collection of prestigious creative account wins (including Ford from WPP) that should help to underpin this trajectory into next year, markets seem to re-discovering the attractions of what remains one of the more reliable trading groups in the sector. Delivering a near +3% improvement in organic sales growth may also have helped remind fickle investors that an implied GrowthRating of under +1.5% (that it had sunk to) was incongruous with the organic sales growth that the group was clearly already showing it could deliver, notwithstanding weak US markets.
No one said it needed to be a ‘growth stock’ to be cheap.
But, you don’t just have to take my word for it. One of the benefits of the GrowthRater is that it cuts thru the waffle you normally get in ‘research’ by showing you what markets are actually pricing into a stock. What you might notice from the below chart, that I pulled off the GrowthRater WebApp on Omnicom, are two things. Firstly, the extent to which the growth rate (the orange series) being priced into the stock tracks both the cyclical and structural trends in organic revenue delivery (the blue series) and that both have been in longer term structural decay.
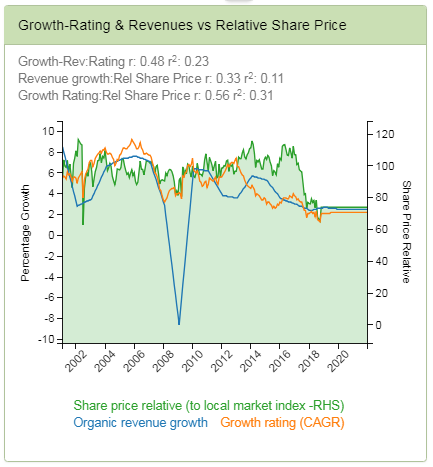
See anything interesting?
From the above chart, the relationship between implied growth priced into the stock and the organic revenue growth delivered should be self-evident. Average out these trends over a trailing 10 year period and in the below table one can see just how close these series have averaged; with implied growth priced into the stock (of +3.6% pa), within 50bps of the average organic sales growth (of +3.2% pa) over the same period.
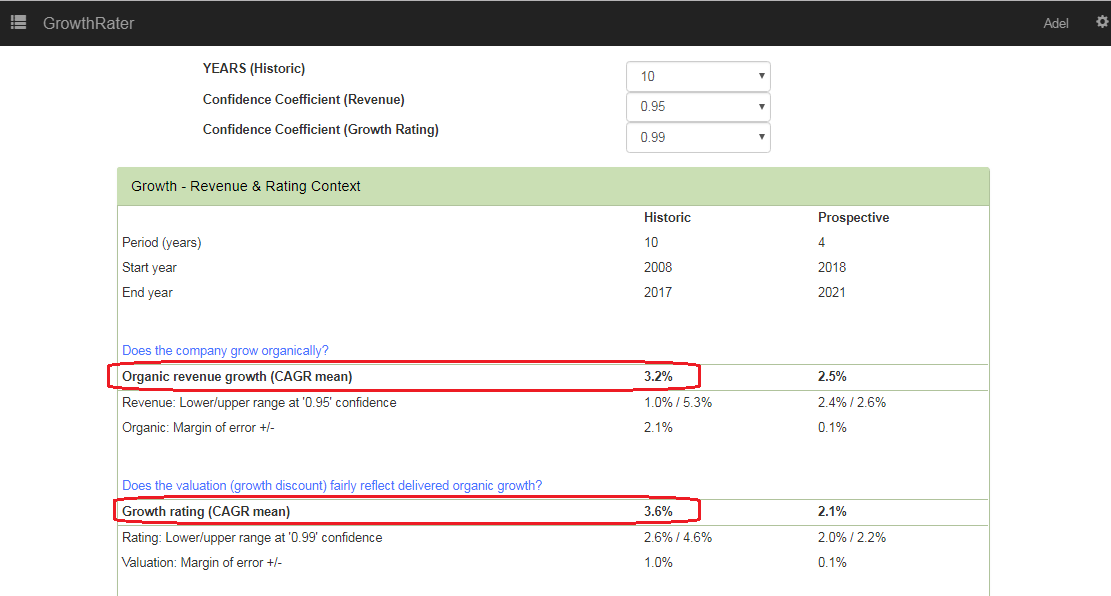
Conclusions from all of the above?
The most glaring must surely be the extent to which the rating markets price into the stock are reactive to the growth being delivered, rather than in anticipation of future growth. Yes, markets clearly don’t have a clue on what growth to price into this sector, hence it is prone to price in over-enthusiastic growth rates into recovery and then over-react on the downside once growth stalls at the end of the cycle. With monetary easing reversing, we are now at such a point. Slowing sales growth however, doesn’t necessarily mean the end of the world, although as with previous cycles, that seems to be what markets were once again discounting in the valuation. While the eroding structural trend probably means one ought to be pricing in a lower growth range than the +2.5-4.5% CAGR range the stock was trading in during most of the last decade, or perhaps even the +2.0-3.5% CAGR range seen over the last three years, a near +1.5% CAGR implied growth that the stock had sunk to was looking overdone. Particularly when the group was already delivering +2.0% organic sales growth in Q2 and was still bringing in strong levels of net new business to help underpin the trajectory into the year end and 2019.
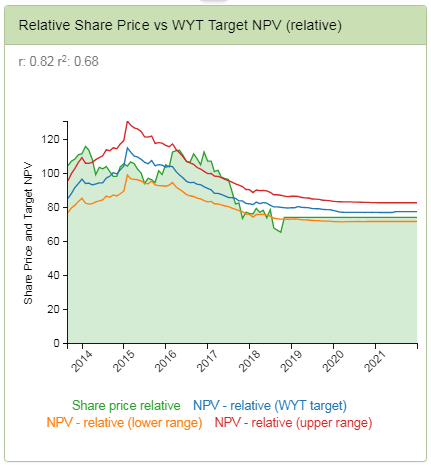
Expanding the chart showing the growth implied from the stock price (the GrowthRating – the orange series) against the organic sales delivery (the blue series) and I hope the relationships become clearer and particularly against the relative share price performance. Over-pay for growth, particularly against a declining trend of organic sales growth (as we’ve had since 2016 and the ending of QE) and you’re asking to lose money. Buy growth when the rating has over-shot on the downside and dropped to a significant discount to growth delivered and you stand a better chance of outperforming. While it is always difficult to gauge how far the knife might fall, if organic sales growth is already stabilising at a meaningful premium to the GrowthRating, it can often offer an attractive entry point, as today’s +7% stock price rebound can attest.
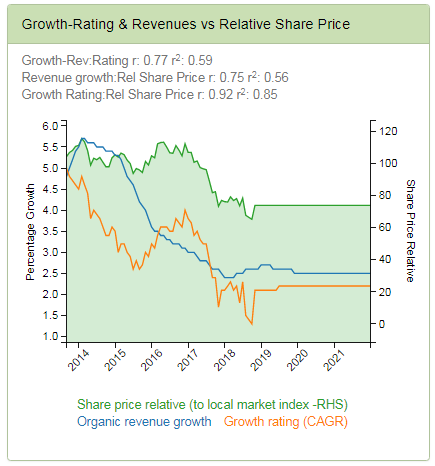
Buy growth when it’s cheap and sell when overpriced
Isn’t this much easier to navigate?
The GrowthRater extracts patterns and trading relationships to help better understand the way growth trends are priced into relative stock price performance. This includes a recognition that there is a natural margin of error in both revenue outcomes against forecasts as well as the growth trends being priced into the stock. Apply this around the +2.0-3.0% CAGR target GrowthRating range I estimate for Omnicom, and the Buying and Selling points start to become clearer as the stock price extended above and below the upper and lower ends of this range. At the end of the day it really isn’t rocket science; buy unerpriced growth and sell it when its expensive (relative to what’s being delivered). Without the GrowthRater to reveal these metrics however, it is perhaps understandable how confusing it all must seem.
A reliable trading range