What equity valuations might be trying to tell you!

Hang on, according to the ‘experts’, this wasn’t supposed to happen!
Having been fed a diet of gloom by everyone from Hedgies (Bridgewater), Academics/Economists (Dartmouth/MITI/Krugman), Banks (Citi) and wealthy investors (Mark Cuban – see end for links) should Trump get elected, markets have done what they do best and confound the experts, with US equity markets rising in tandem with the US dollar. While ‘The Donald’s’ numbers may not yet add up, the combination of an America first trade policy, higher deficit spending on lower prospective corporate tax rates, has shifted cash out of its trading partners and into US dollars, but in favour this time of equities rather than bonds, where the yield curve is steepening.
- For the S&P500, that has meant a near +6% bounce in average stock prices since just prior to the Presidential elections.

Market rally rather the collapse that was predicted by the financial herd
- And unlike for post Brexit UK markets, the US dollar has also strengthened, which makes the performance all the more impressive as it will be dilutive to US dollar earnings. For a Euro investor into the S&P500, that represents a Euro appreciation of over +10% in the month. Not bad given the dire predictions ahead of Trump presidency.
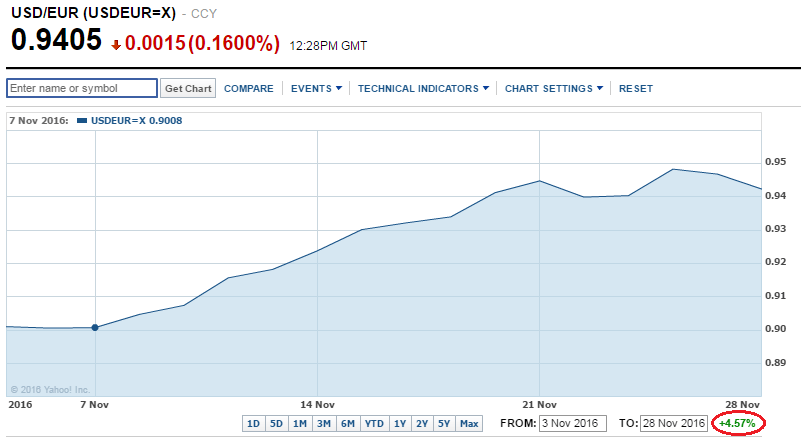
Trump win also rallies the US dollar on higher rate expectations
Best to choose the right metric first!
To try and put current equity valuations into perspective, the popular pastime of market pundits is to play the mean reversion game. Unfortunately this is all too often done against both the wrong metric and on the wrong basis. The wrong metric usually being an ill-defined post interest earnings multiple, while the wrong basis being the attempt to take an absolute return, however calculated, out of context to a comparative risk/return.
Operating free cash flow yield or PER?
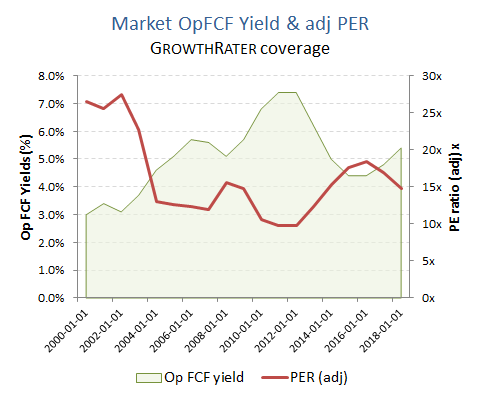
The below chart of the headline PER multiple on the GrowthRater coverage universe and normalised OpFCF yield is probably as good as you’re going to get in terms of a consistently defined valuation metric and those with a ruler can start drawing lines and perhaps the wrong conclusions as to whether the current ‘premium’ apparently being priced into equity prices represent poor value.
Scope
With a market Cap of probably $8tn and revenues in excess of $6tn I think the GrowthRater coverage universe is fairly representative of the non-financials. Interestingly, taking just the FTSE listed stocks doesn’t change the aggregated Op FCF yield numbers much, which suggests that markets are fairly efficient in arbitraging value on this basis. I’ve added in a PER multiple as well as people still seem to cling on to this for some reason. I have however, used a consistent definition for this (unlike many others) which excludes exceptionals (incl impairments etc), acquired intangible amortisation but does include stock compensation charges.
Absolute returns in isolation are not a measure of value
A cross/reality check to reconcile top down with bottom up between OpFCF & adj PER
As an aside, you might be interested in the average net income to FCF conversion rates from my coverage universe. As you can see, this averaging at around 74% since 2005 and compares with a long run assumption of 80% on my top down cross check analysis from the broader market PER estimates (albeit with external data suppliers often applying inconsistent definitions and shifting scope – I was never able to get these providers to provide the actual sample groups they used to calculate these aggregated consensus estimates, as they tend not to use total market data). The reason I take a slightly higher conversion assumption is to adjust to the likelihood that interest costs will have an approx 100% cash conversion (possibly raising the operating cash conversion to nearer 80-85%), although stock comps exclusion (hidden amongst share issuance) ought to be recognised as a real operating cash lien which would bring the real conversion ratio down a little.
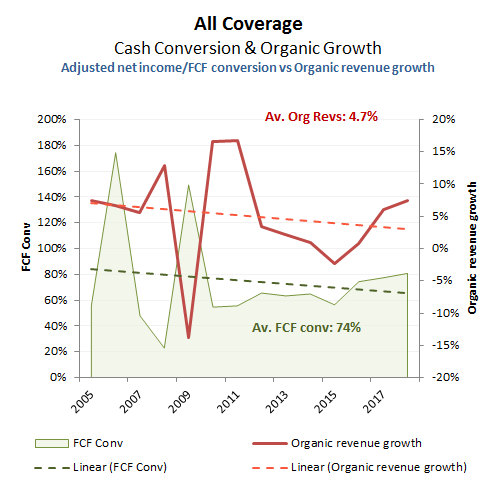
How much FCF has to be re-invested to sustain what rate of organic growth
Relative return/relative risk
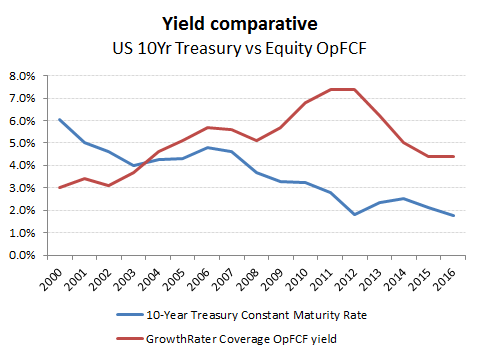
Returns of course, are relative; relative to risk and relative to growth. Historically, the anchor has been the long bond/gilt yields (including index linked) which offers a proxy for the risk free return, albeit now substantially screwed around by central bankers with QE. Notwithstanding some slippage in inflation and nominal growth expectations, the below chart of our OpFCF yield for our coverage universe looks a lot different when compared to the relative returns on US 10 year bond yields.
While the excess return as measured by the OpFCF yield versus the 10 year bond yield may have halved compared to where is was back in 2012, it is still over +200bps ahead of current bond yields and compares to a discount up until around 2004. Taken on a relative running yield basis therefore, the equity markets are perhaps not that expensive. Add in the additional liquidity looking for a home should monetary policy remain accommodative, together with a rotation out of bonds on the expectation of a slight rise in interest rates and it is not difficult to see why equity markets are stronger.
We’ll look at this in a moment, but when looking at the expected excess return being priced into equities (the equity risk premium), there is no ‘right’ or ‘wrong’ level, only the perceived forecasting risk or the weight of liquidity prevalent at a given time. Sure, we have a view, but the market cost of equity is what it is and not what we would like it to be and at no point do we seek to impose our subjective view in the GrowthRater valuations, which are constructed on market neutral basis.
Yield inversion – growth, risk or inflation?
Excess returns from stocks – the Equity Risk Premium
So what is that equity risk premium? Well first, what is the risk free return? As mentioned earlier, this used to be relatively simple, until central bankers and governments started to screw around with the bond market, issuing credit to buy back in government debt and driving down apparent yields notwithstanding continued deficit financing and continued high rates of real interest rates underlying the manipulated official statistics. If you were pricing other asset classes on a fixed relationship to these bond yields, then these would rise proportionately to the drop in bond yields. Welcome to the world of financial repression, where manipulation of the key pricing mechanism for pricing assets is manipulated with the specific intention to force investors up the risk curve in the absurd hope that it will stimulate consumption. Fortunately markets are a lot smarter than that and while the apparent ‘risk premium’ has expanded significantly, the overall equity cost of capital hasn’t, suggesting markets are looking through the ruse to when rates ultimately normalise.
Risk free returns – are long Govt bond yields still an anchor point?
The BoE helpfully provide this data which you get at the below link. As you can see, it seems to be currently trying to be a sine wave on the fixed Gilts; approaching 3% from Years 10-15 and then falling back to almost 1% by year 35. Clearly some heavy QE distortions.
Yield Curve – (http://www.bankofengland.co.uk/statistics/pages/yieldcurve/default.aspx)
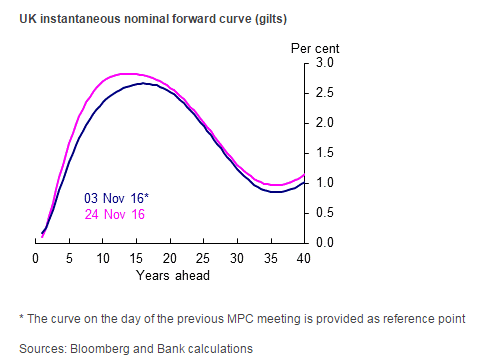
A Gilt yield curve that’s looking more like a sine wave!
- The index linked yields meanwhile are a little more stable, albeit in a tighter range of approx -1.2% to -1.45% once you get out beyond 5 years. Compared to the approx 1.5-2.5% historic real yield the IL’s used to trade on however, a negative yield remains an absurd distortion. If central banks were individuals they would be locked up for racketeering!
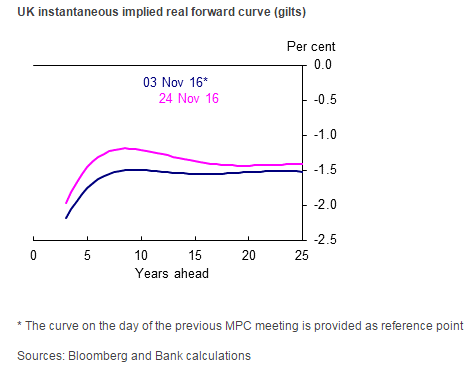
Negative IL yields = lend to the Govt and lose money
- In case we can’t subtract one from the other, they also helpfully give the implied inflation rate being priced into the Gilt markets. I find there is a certain irony about central banks using deflationary fears as a pretext for currency debasement and debt monetisation when their instrument of choice, Govt debt priced in the complete opposite. Seems more like a scene out of Mars Attacks when they keep on believing they come in peace
(https://www.youtube.com/watch?v=_vUrAMxmO_A)
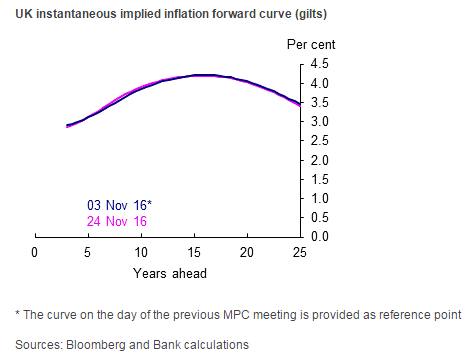
What Gilt markets are pricing in for inflation
Markets aren’t stupid!
Central bankers may have persuaded some little old grannies and a few bankers to move up the risk curve in search of a better yield during the current financial repression, but equity markets have been surprisingly resistant to the temptation – apart that is from corporate treasurers who have been buying in their own shares notwithstanding that in many cases this is value destructive.
Notwithstanding a reduction in Gilt/Bond yields of almost -3ppts over the last decade, equity FCF yields are down by less than half of this, inverting further what had historically been an equity yield premium. If this was just a function of a massive contraction in inflation assumptions, then why is this not reflected in bond pricing? Perhaps it is a reflection of substantially reduced growth expectations – although again where is the evidence for this? During the period, China has emerged as an accelerator to global growth and while the trend line in organic revenue growth in the above chart is slowing, this is only marginal – ie it’s not growth! If you knock out deflation or slowing growth, then the only remaining explanation must be that markets have been increasingly disconnecting from bond markets, choosing instead to look thru the current manipulation of rates towards an environment when these revert back to some sort of norm.
Equity cost of capital
Assuming a constant real growth of +2% CAGR for company Op FCF growth (using trend GDP as a proxy) and applying the implied inflation rate from gilt yields against the equity market Op FCF yield and and I estimate the current market equity cost of capital is just over 9%. Depending on where you go on the long gilt yield, this is going to suggest an equity risk premium at a massive 7-8%. Of course this is the whole point of financial repression and its attempt to reallocate capital to less compelling or less safe investments. In the case of equities however it hasn’t really worked as the stability in overall expected equity returns (ECC) can testify. If you believe that financial repression is the new normal and will never end, then one might expect a further squeeze on the ECC as investors capitulate and rotate up the risk curve and into equities. What I find less clear is whether currency markets can continue to bear the endless QE and deficit financing of state and private over-consumption. I refer to currency markets because I don’t believe politicians and central banks will have a pauline conversion to honest money as they are too far down the rabbit hole to reverse direction. Trump can’t afford to have the Fed cut the ground from under him by stopping debt monetisation and raising rates. While there is little love lost between them, such an action by the Fed would be counter-productive, unless the plan is to bring down the house. The US might weather the storm with trade barriers and tax cuts to keep up the demand for US dollars which they would need to keep selling, but what of the rest? Can you imagine the ECB’s NIRP surviving when the EU is already fracturing or the outlook for Chinese debt and export driven growth or anyone who would want Yen? How many Spaniards would be able to buy mercedes when Spanish long yields are nudging 10% again?
At the end of the day, Trump’s threat to dissolve the Fed is to keep them in line. I’m sure we’ll get some big headlines of rate increases, but these will be largely cosmetic and money will go back under the table such as will possible student loan forgiveness and such like. Pretend to be fiscally responsible so you can keep selling your debt/currency and keep the party going. The end game therefore won’t be the Fed doing something stupid (as it did this years ago by not normalising rates earlier), but when currency markets finally dump the US dollar. At present though, that doesn’t seem imminent with even the slightest hint of high long bond yields puncturing precious metals prices.
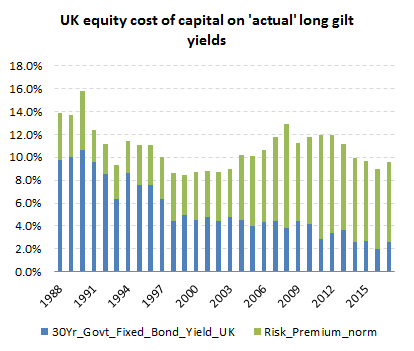
Total cost of equity has been more stable than the implied risk premium
Modelling ECC and ERP on a normalisation of bond yields while also aiming off on OpFCF’s
Below, I’ve put a table showing the implications on the ECC and ERP of running the prospective equity market Op FCF yield of approx 4.7% along the UK gilt yield curve. I’ve also included the implications of applying the 5 year average long gilt yields up to 2008 ; ie before the overt central bank manipulation of yields and market distortions. While almost halving the ERP (and therefore relative appeal of equities), the absolute rate would still be substantially ahead of the historic ERP levels. Of course a near doubling of long bond yields is going to have some possibly serious consequences for consumption and therefore company profits and FCF. At this stage I doubt even the best of econometric models would be reliable in quantifying the potential impact beyond it being negative although it would be interesting to see what the sell-side come up with. https://www.youtube.com/watch?v=nR0lOtdvqyg
By way of perspective, in the below table I have modelled a progressive cut in the 2017 Op FCF estimates from -20% to -50% using the normalised bond yields to estimate the impact on ECC and ERP at current market levels. While the reductions in ECC and ERP at the more extreme end of the range are not without historic precedence, these have only been sustained during a mature bull market, which presumably would not apply in these circumstances.
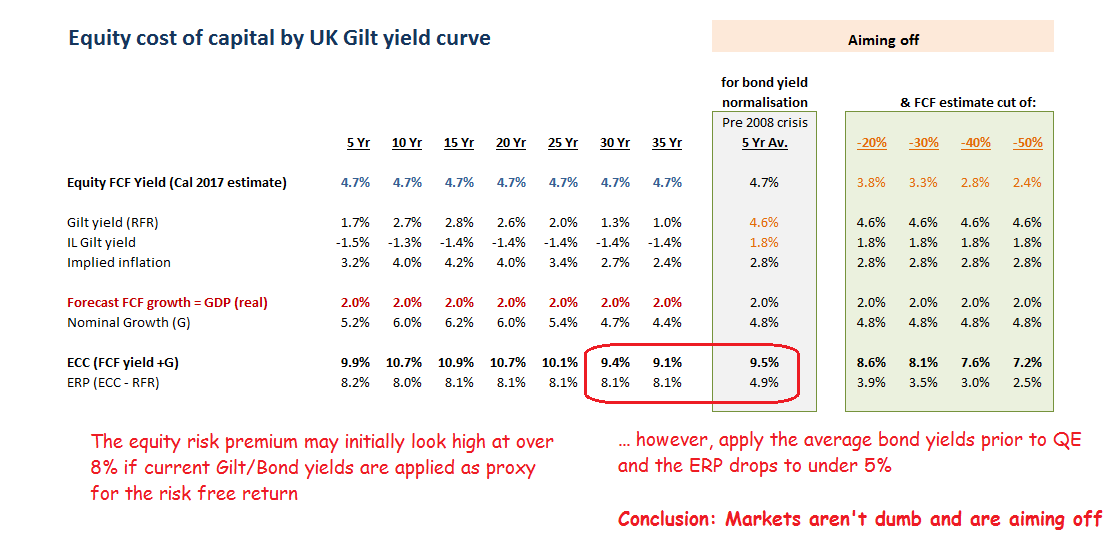
Markets aren’t stupid and aim off
Links to some of the failed prophets of doom!
• http://www.marketwatch.com/story/the-stock-market-could-crash-if-donald-trump-is-elected-2016-10-31
• http://www.politico.com/story/2016/10/donald-trump-wall-street-effect-markets-230164
• http://fortune.com/2016/11/08/donald-trump-stocks-crash/
• http://www.nytimes.com/2016/11/01/business/dealbook/what-happens-to-the-markets-if-donald-trump-wins.html?_r=0
• http://www.forbes.com/sites/robertberger/2016/11/10/how-donald-trumps-presidency-will-affect-the-stock-market/#7aecab0558f1
• http://www.thefiscaltimes.com/2016/09/06/Mark-Cuban-Stocks-Will-Crash-if-Trump-Wins
• http://www.cnbc.com/2016/03/16/if-trump-wins-stocks-will-drop-50-wedbush-pro.html