Thomas Cook Group – analysis, or time for catastrophe modelling?

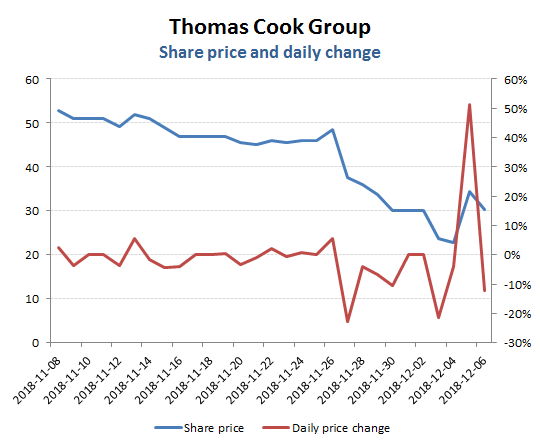
The recent gyrations in the Thomas Cook share price (a +50% surge yesterday and -13% correction today), might have you reaching for your catastrophe models, but its volatility after its latest guidance cut ought not to be that surprising. Combine a volatile top line with low margins, substantial financial leverage and a low rate of underlying cash generation and the swing component on the overall valuation that is represented by the equity is inevitably going to be all over the place, particularly as the group skirts dangerously with a debt event horizon.
For TCG investors, or potential investors therefore, anticipating the directional shifts in trading expectations is only part of the story. As important, is the ability to measure the potential volatility in outcomes and impact to valuation. As each group trades through an economic cycle it exhibits a natural volatility in organic revenue outcomes as well as valuation ratings and where these ‘margins of error’ can be measured and dropped through their prospective capital structures to reveal the potential margin of error on the valuation. It is this margin of error on valuation that is highlighted in the ‘Summary’ section of the GrowthRater for each company in order to enable investors to gauge whether the potential upside to a valuation target provides an adequate compensation for the level of risk being incurred; and something that can be compared across differing groups. Upside and downside valuation opportunities are rarely symmetric and neither is risk. The assumption in WACC based valuation models that risk is a negative feature is also flawed, in that volatility can be a desired outcome when combined by a degree of directional confidence in outcomes and of course dependent on the extent to which markets may already be pricing these into the stock price. Everything therefore is a balance of risk and reward and what we at GrowthRater are doing is to help provide investors with the tools to measure these relative to current stock levels as well as being able to amend the valuation by folding in some of their own trading assumptions.
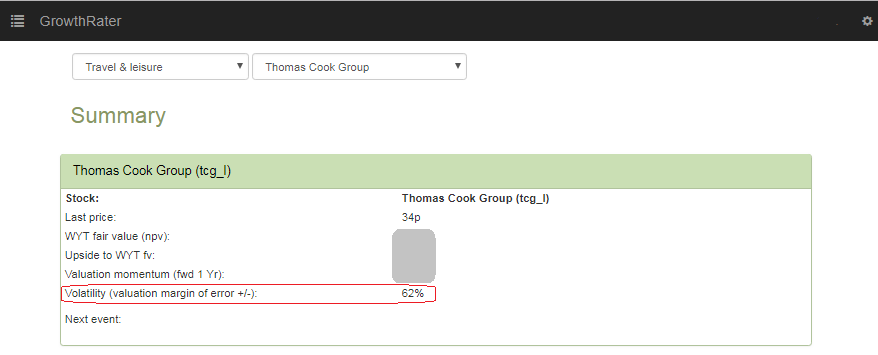
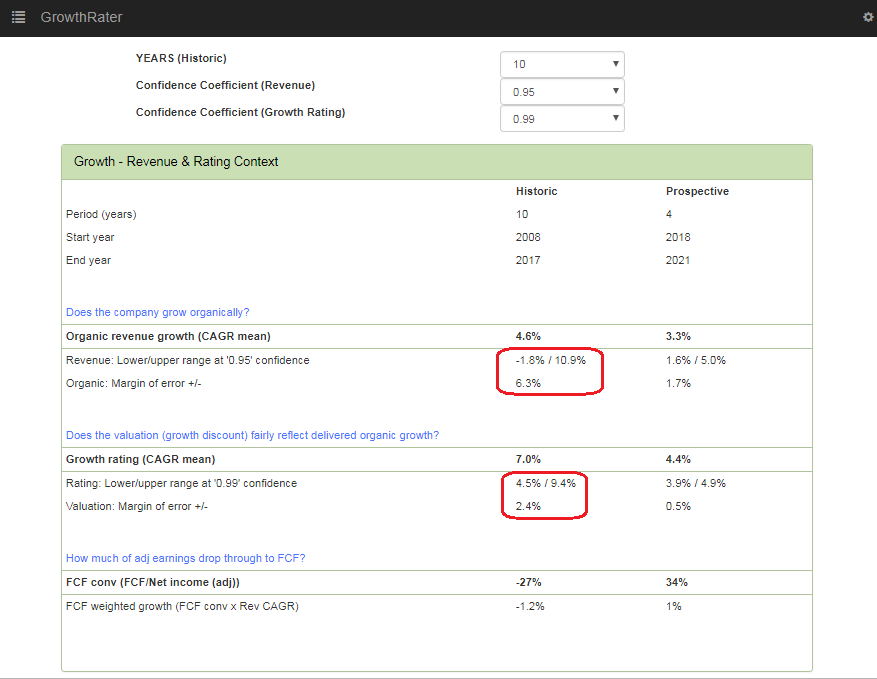
For TCG, a 62% margin of error (+/-) on the valuation is around three times the average across our >$12tn MV coverage universe. In part, this is a consequence of the volatile historic organic revenue growth record, which over the last decade has ranged between about -2% and +11%, on a 0.95 confidence coefficient, with an over 6ppts margin of error. Drop this through the modest margin base, an average drop-thru rate of 13% and the underlying net debt (rather than the window dressed year end numbers) and you might be getting some idea of the leverage being exerted on the rather modest part of this iceberg that is above the water. On top of this, one then needs to take into account the broad valuation range that markets have applied to the stock (with a 2.4ppts (+/-) margin of error) together with the additional existential risk of a low OpFCF interest cover
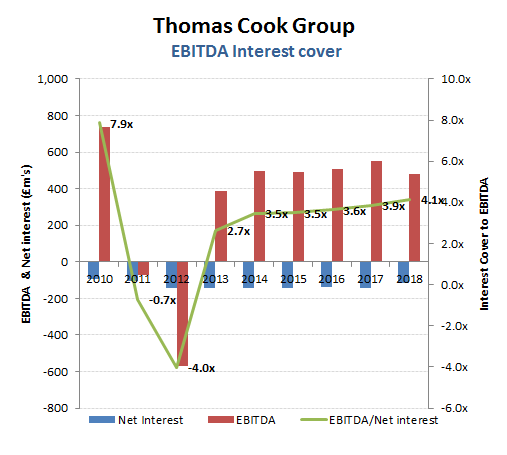
On many traditional measurements, investors might feel relatively safe with TCG’s financial position, with year end net debt at under 1x EBITDA and EBITDA interest cover at around 4x. Those figures however, will no doubt alert you that either the group has a highly inefficient mix of very low interest yielding cash and a lot of much higher coupon gross debt or that there is some considerable year end window dressing on the debt numbers that flatters what must therefore be a considerably higher average debt position which will need to be recognised in any EV adjustment.
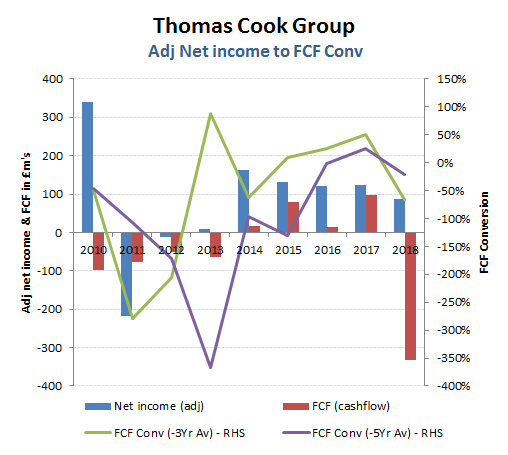
Of course, the ‘adjusted’ figures that companies like to play around with are geared to show them off in the most flattering light when the real valuation is going to be determined more by the underlying operating free cash capacity of the business. ‘One offs’ can justifiably be excluded, but groups can easily become serial abusers of using EBBS trading figures (Earnings Before The Bad Stuff!). This however, gets caught by analysis of adjusted net income to FCF conversion metric, which for TCG has struggled to exceed 50% on either a 3 or 5 year trailing basis.
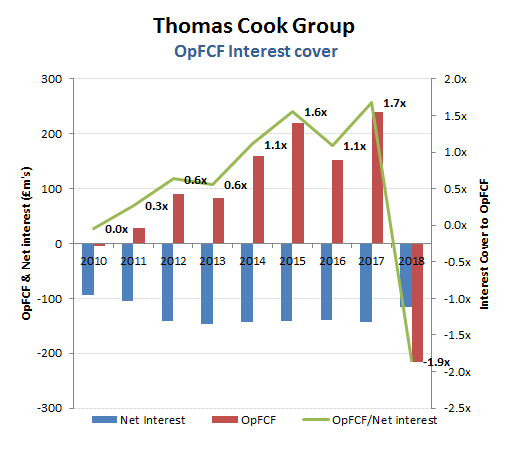
The implications of this on the real effective interest cover, that being the extent to which interest costs are being covered by operating free cash flow, can present a considerably more worrying picture. Suddenly the group which had a reported net debt to EBITDA of under 1 times and an EBITDA interest cover of 4x, is revealed as averaging an OPFCF cover to interest of only around 1.5x and which on last weeks forecast cut might be approaching a negative -2x for the year just ended.
With an equity value of only around £500m poking its nose above about -£2.3bn of average debt and other adjustments, progress from here is obviously going to be highly sensitive (and leveraged) to even modest changes in revenue and margin expectations. Just how sensitive, you can find out for yourselves. You already have the margin of error on organic revenues, so you can use all or part of this as an an adjustment to expected revenues in the “Sensitivity” section of the GrowthRater WebApp, which will then revalue the group for you. Have fun!