US Agency revenue growth plummets in Q3 – the canary in the mine

With less than a week to go and Trump edging ahead in some polls, albeit possibly still behind with regards electoral college votes, there’s going to be some sweaty palms in financial markets. A month ago, a Clinton victory may have seemed like a slam dunk and indeed one bookie (Paddy Power Betfair) was reported to have started paying out on a Clinton victory as a foregone conclusion (Ooops?). Now with odds on a Trump victory being slashed to 2/1, it may be difficult for markets to focus on much else, given The Donald’s protectionist views and hostility to the Fed. That is a pity, as there is some useful data coming out of the tail end of the Q3 results season which suggests a weaker underlying economic performance in the US than the last GDP figures were suggesting, but may well be drowned out by the background noise.
In previous posts I have already highlighted a number of deficiencies with the headline GDP growth figure of +2.9% ‘real’ reported for Q3, which was pumped up by adjusting the deflator and supported by inventory build and soyabean exports to disguise slowing growth in disposable incomes. Excluding these one-off items and Q3 GDP would have been almost flat-lining!
http://growthrater.com/us-q3-gdp-bounce-exaggerated-soyabeans-deflator/
After 8 years of supposed recovery, state and local tax receipts are also falling for personal income, consumption and corporate taxes. The one area where taxes are still rising is for local property taxes which reflect higher property values which in turn are a function of the super-low mortgage rates and availability which the Fed is now being expected to snuff out with a rate rise.
http://growthrater.com/us-state-tax-receipts-fall-2-2-hardly-prelude-fed-rate-increase/
Behind the managed statistics for the deficit, there is a ton of stuff they regard as out of the ordinary and exclude, although these are anything but. If you follow the money (or should I say debt), then last year’s deficit was nearer 8% of GDP rather than the sanitised 3.2%. I’ve seen this sometimes justified during the depths of a recession, but at the end of a ‘recovery’ cycle this is taking the reliance on controlling the World’s reserve currency to extremes. http://growthrater.com/us-reported-federal-deficit-587bn-dwarfed-cash-deficit-1-4tn/
On Friday, we get the non-farm employment data for October. With the tightening election outcome you may be forgiven to have other things to worry about, but these figures can provide a direct window on whether corporates are actually investing in growth or cutting and can act as the proverbial canary in the mine. While employment growth has picked up since stalling in May, it is still well below the rate of growth in jobs or average wage growth to suggest an impending inflation problem.
http://growthrater.com/september-us-non-farm-payrolls-fall-short-expectations/
Another ‘canary’ is marketing investment. As well as stimulating credit and consumption, a low interest cost environment also improves the marginal returns from allocating additional capital to marketing budgets, making advertising media a major beneficiary of a low interest rate environment. It also makes them highly sensitive to a slowing outlook for consumption which might be doubly impacted by a rate rise.
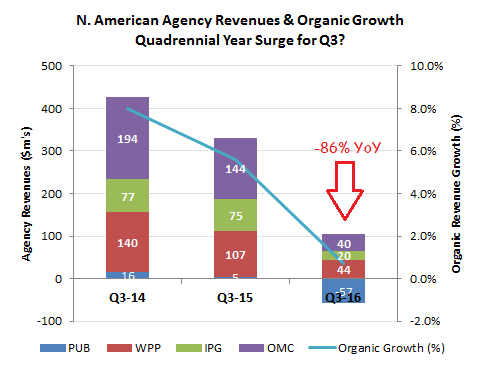
While at least one CEO of a major marketing company has recently refuted suggestions of a slowdown in Q3 growth for US marketers, the data suggests otherwise. Notwithstanding the quadrennial year support of US Presidential Elections, Olympics and footie, supposedly contributing an incremental +1ppts to US advertising budgets, this hasn’t protected organic revenue growth rates for the leading marketing agency groups. While the ‘palooza’ of client account moves last year have distorted the growth rates for individual agencies, as a group, these shifts will have evened themselves out. In the below chart I have therefore aggregated the top 4 agency groups and rebased in US dollars to gauge the underlying trends in US organic revenue growth for the third quarter in each of the last three years. The data is clear, there has been a significant erosion in growth this year across all companies and as a group by a whopping -86% YoY for Q3 this year (from +$331m in Q3 2015 to only +$46m and +0.7% for Q3 of this year. Against Q3 of the previous year (Q3 2014), the shortfall is even greater, with this year’s Q3 down by -89%.
Slowdown? What’s the data saying?
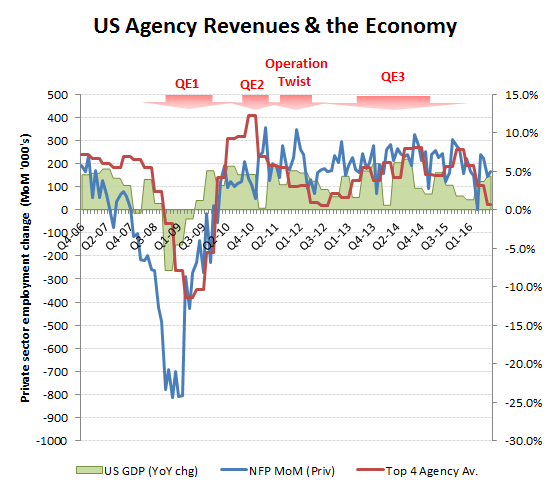
What happens for US organic revenue growth for the leading marketing services groups, broadly reflects the wider US economy. While perhaps not as early an indicator as monthly non-farm payroll data, when both canary’s are singing the same song its often time to look for the exit.
Two strikes and you’re out!
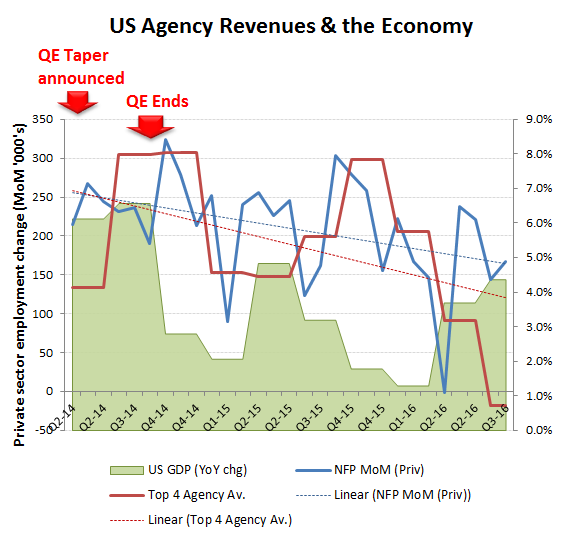
At first sight, two of the three data series seem to be holding up, with only agency US organic revenue growth hitting the dirt. Looking at the trends following the ending of QE3 however and another pattern emerges with declining peaks and troughs across all series. Having already established that Q3 GDP growth could be trimmed by -90bps from just the soyabean export one-off and more without the inventory build, then we are left with this coming Friday’s non-farm payroll data. Already with a declining and volatile trend, a shortfall here would sound the alarm bells. Add in a Trump victory, with all its protectionist connotations and a parting shot from the Fed with an interest rate increase and this doesn’t look like the time to go long on risk in one’s portfolio.
Look for the trends