Are equities expensive?

The spike in US bond yields has implications for equities, but perhaps not as directly as one might imagine. Yes, long bond yields and particularly TIPS, provide an effective proxy for a risk-free return and therefore the essential anchor for valuing other asset classes, but only from a relative rather than absolute perspective. It may tell you an implied cost of capital and risk premium for various financial instruments, but not whether these offer an adequate return. For this, one needs to look more at the liquidity underpinning the balance of buyers and sellers and this is where the shift to a less accommodating monetary policy becomes a determining factor and one which could also have significant ramifications for the consensus earnings expectations on which the whole valuation edifice is invariably constructed.
At present, the pace of balance sheet tapering by the Federal Reserve is relatively modest, currently running at well under $50bn per month. For now, this is being mopped up by around $35bn per month of asset purchases under the ECB’s QE programme, while China’s PBoC has recently announced a further relaxation in some banks reserve requirements, which could pump an additional $100bn of liquidity into markets. Maintaining such an accommodating stance however, will prove difficult against a tightening US policy while the US dollar reserve status persists, as perhaps evidenced by the ECB signalling its intention to abandon its QE by the year end.
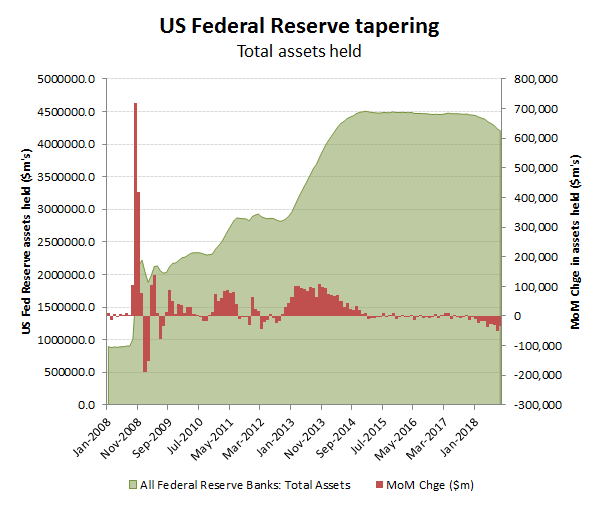
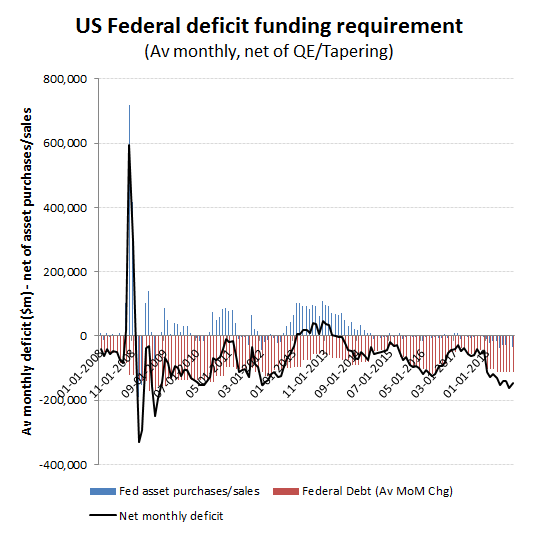
The current US Fed tapering meanwhile is just the start of the process of unwinding its >$4tn balance sheet. Add in the deficit expansion that is currently running at an average of around $112bn per month and the scale of the liquidity drain becomes more apparent and considerably more worrisome. At the current modest rate of tapering the US is therefore borrowing around $150bn per month from markets, paid for by increasingly punitive tariffs.
As US real rates rise (so far implied inflation remains muted) and domestic GDP holds up, those trading partners at the sharp end of these tariffs are going to struggle to sustain their accommodative policies based on financial repression. Cash will gravitate out to the higher yielding and stronger growth US, while the potential offsetting benefit of the competitive currency devaluation could just get negated by further tariffs. Barring the nuclear option of a return to exchange controls to stem this prospective liquidity flow, both China and the EU will need to learn to live with higher interest rates; something that should be a cause for alarm given their overstretched finances and wasted opportunities for structural reforms. Try imagining how smug the EU would be with Spanish and Italian 10 year yields back above 7% rather that the current fictional 2% delivered courtesy of the ECB!
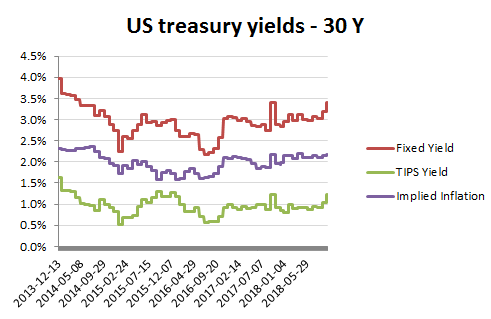
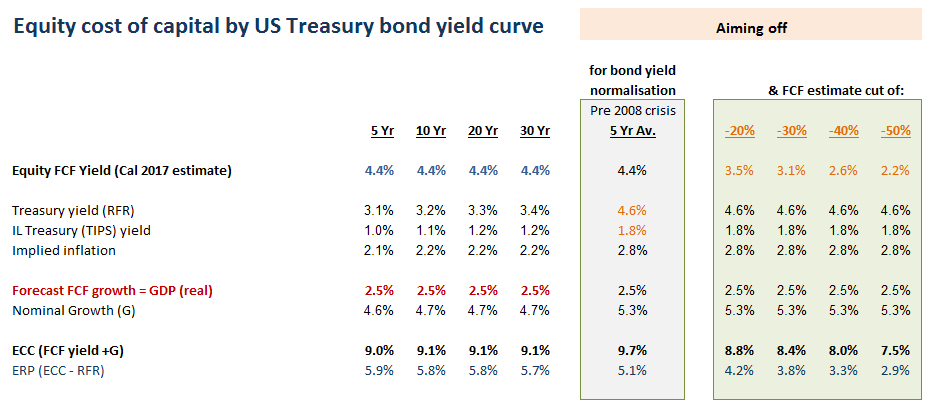
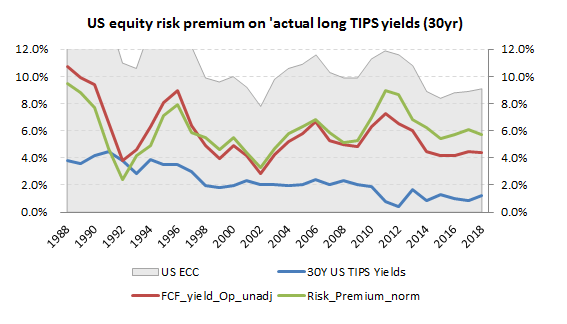
This then pretty much takes us back full circle to where we started, the equity risk premium. As I’ve mentioned before, there is no right or wrong risk premium, it just is what it is and that being a function of the net balance of liquidity between buyers and sellers. taking the US long TIPS yield as the risk free return proxy and applying this through the cleaned up operating free cash flow yield data from the GrowthRater database and below chart returns the historic results for the market equity cost of capital and risk premiums. With an aggregated market capitalisation in excess of $12tn across the leading non-financial sectors, I would vouch that these are robustly based and representative results.
Equity risk premiums however, are fluid; hence why it is dangerous being too dogmatic as to whether a market is cheap of expensive on a given number. In part that is simply a reflection of what the premium is there for; to compensate for the risk that the forecast is wrong. As referred to above, there are plenty of reasons why going into a tightening cycle, possibly exacerbated by tariif wars, or worse, that markets might feel the need to aim off a bit when it comes to the forecasts on which all these return assumptions are being made. By way of example, in the below table, I have mapped out the current implied risk premium on current bond yields and market forecasts, but then applied some adjustments to these assuming a reversion to mean for bond yields and inflation as well as an economic hard landing, with a -50% contraction in company FCF. Is a 2.9% risk premium still a compelling return on this lower range? That is for you to decide.