Gartner Inc – Consensus forecasts in straight lines are usually wrong

Nature may abhor a straight line, but analyst forecasts don’t seem to, even when estimating revenues for a business with an historic margin of error on revenues of over +/-4ppts. I take a look at Gartner as consensus forecasts predict what its never achieved before, a straight run of revenue growth and into a slowing IT/Tech segment.
The GrowthRater’s mean reversion analysis seems to have a good handle on the key drivers to Gartner’s valuation, with a trailing target NPV to share price correlation at 0.94. Indeed, should one apply the consensus revenue forecasts, the target NPV would come in broadly in line with the current share price. The problem however, is that the consensus estimates are probably wrong and appear to be little more than applying a steady trajectory to the last tangent on the chart, notwithstanding the volatile record and a margin of error on revenues that has exceeded +/-4ppts over the past decade. If forecasts are wrong, then which way? Leaving to one side the longer term structural issues relating changes in the way IT information and decisions are made and potential impact on structured paid for reports, the cyclical indicators are erring negative, whether one looks at US Info/Tech employment data or even Gartner’s own KPI’s which on areas such as client retention, backlog or average revenues are also beginning to drift lower (see below). While applying what by historic standards is a mere softening of organic revenue growth into FY17 to sub +5%, this is enough to drag back my target NPV to approx -30% the current share price. I recommend that you go to the ‘Sensitivity’ tab where one can adjust the underlying revenue growth assumptions and remodel the valuations (more below on this).
The GrowthRater’s mean reversion algorithm accurately reflects the way markets value the super-growthers, with the target NPV correlating at 0.94 with the relative share price of the past decade. Looking forwards on the basis of our forecast for a reduction in organic revenue growth to nearer +5% pa for 2017-18 however, the contraction in the valuation horizon suggests a downside risk of approx -30% relative to the market on this scenario.
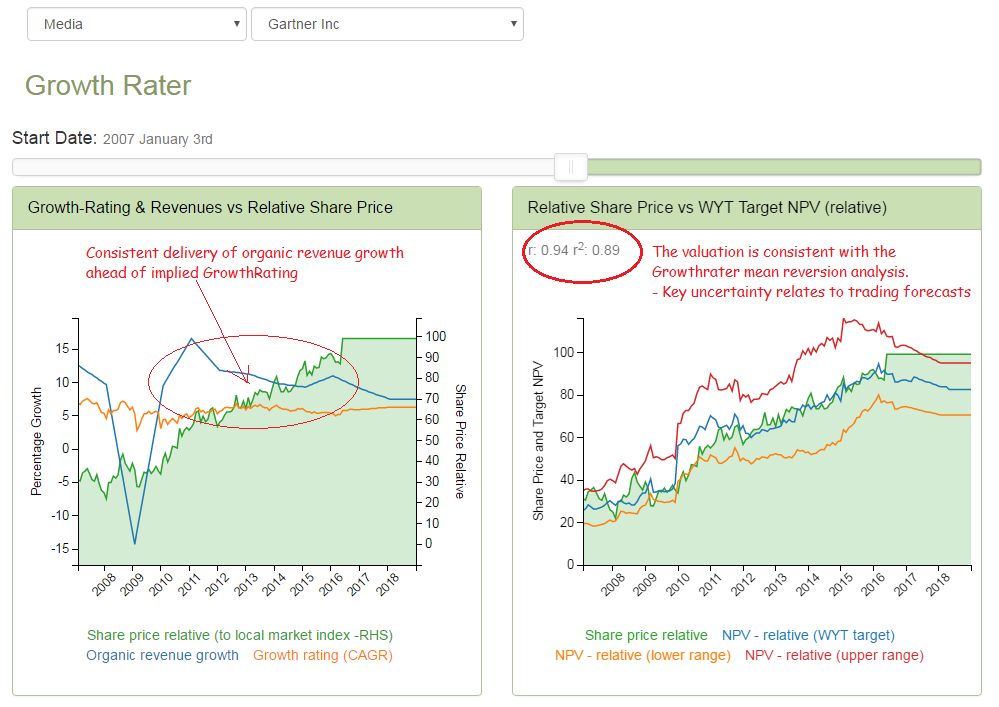
0.94 correlation between Gartner’s relative share price and the GrowthRater target NPV
The mean reversion chart below provides a clear measure of the relationship between super-normal organic revenue growth and the extent to which markets reach forwards to a future horizon before reverting the growth rating (and OpFCF yield) back to a market average. As you can see, the relationship is systematic and it is also immediate. For a group such a Gartner, which has a demonstrably cyclical revenue profile, the valuation horizon ebbs and flows with organic revenues and when organic revenues last fell negative, the drop in horizon reach (and therefore valuation) was immediate and precipitative.
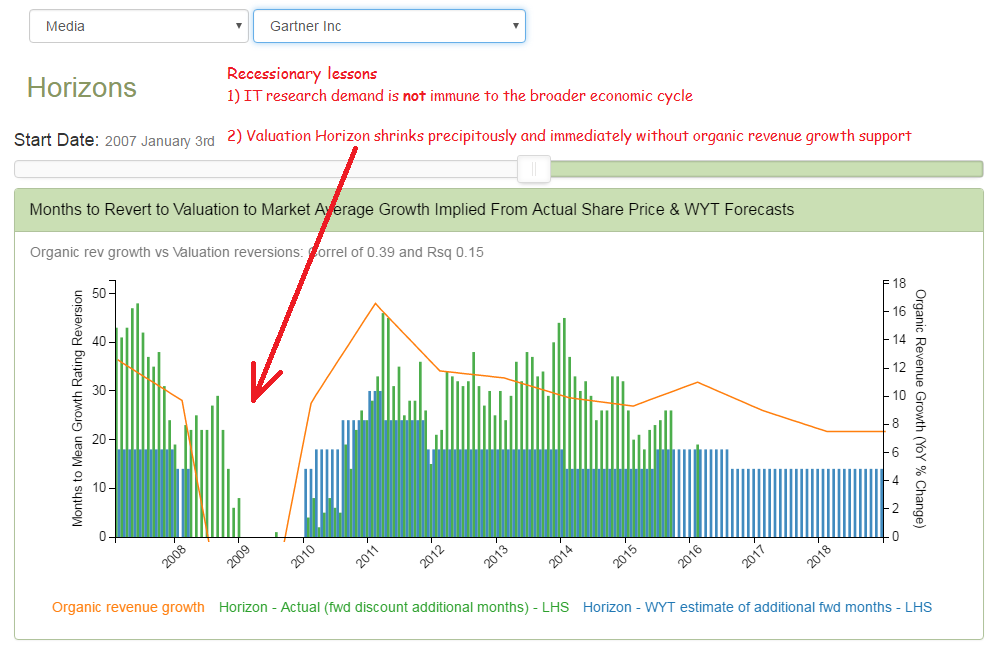
The relationship between organic revenues and valuation horizon is systematic
Notwithstanding this, consensus forecasts seem stuck with a rather straight ruler, drawing a line from the last tangent on the chart. When has Gartner ever grown its revenues in such a linear manner one might ask rhetorically!
The valuation algorithm works, but the consensus forecasts are clearly unreliable. The issue therefore is which way and by how much?
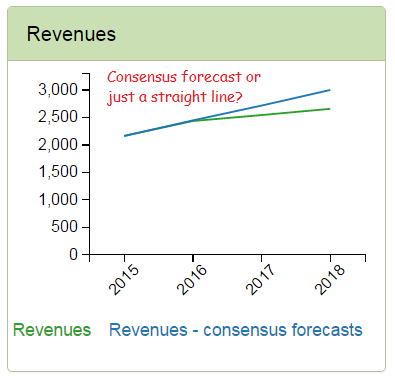
Analysts forecasting with straight lines! (GR forecast in Green)
Gartner makes money from selling paid for structured reports used for IP procurement decisions. It should hardly come as a surprise therefore if organic revenues were correlated to the IT investment cycle, which in turn might be reflected in job formation in that sector.
Smoothing out the rather volatile MoM data for this series into a 6 month moving average and the correlation with Gartner’s organic revenue growth rises to around 0.70, which is statistically significant.
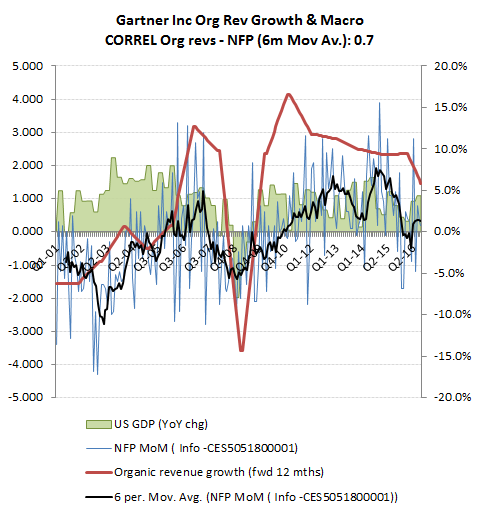
Gartner’s revenues correlate with US Info Tech job data – now there’s a surprise!
So what’s the macro data telling us about the outlook from here? Well if you like declining peaks and troughs, then the trend in US Information sector jobs is deteriorating. Last month posted a slight improvement, although with cuts at the bellwether Cisco and reports that IBM Corp, Hewlett Packard Enterprise Co, Oracle Corp and Dell Inc may follow suit, this may just be a lull in the storm.
Seasonal adjustments salvage what would have been a dire October non-farm payroll number
As for the less representative Q3 GDP figures, strip out one-off soyabean exports, inventory build and reductions in deflator and you’ll get a considerably less buoyant take on the health of the underlying US economy.
What could change? With a new President elect and a still largely undisclosed economic plan, clearly quite a lot. Suggestions that corporate tax rates could be slashed, including incentives for US groups to repatriate overseas cash sound like a boon for increasing internal investment by US companies in the US, which would also include IT equipment. Unfortunately for Mr Trump, his predecessor has left the cupboard pretty bare and such largesse is easier to promise than deliver, particularly if the Fed puts a spanner in the works with an early rate hike.
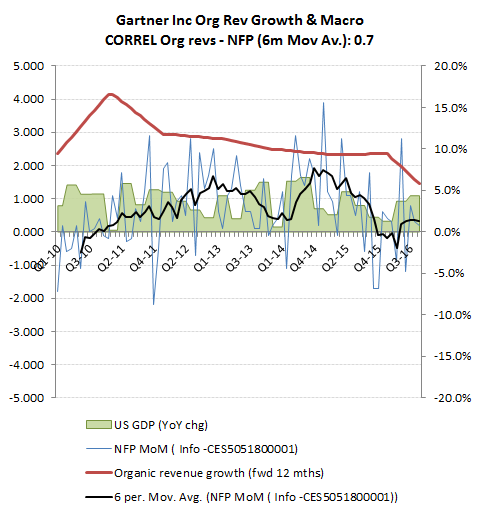
US Info Tech jobs trending lower
Want to check out the valuation sensitivity to a different revenue growth assumption? Easy, just go to the ‘Sensitivity’ tab in the GrowtRater WebApp and add or reduce the incremental revenues via the simple drop-down.
For Gartner, let’s revise up my revenues to the +10-11% pa growth that the consensus estimates are including out to FY18.
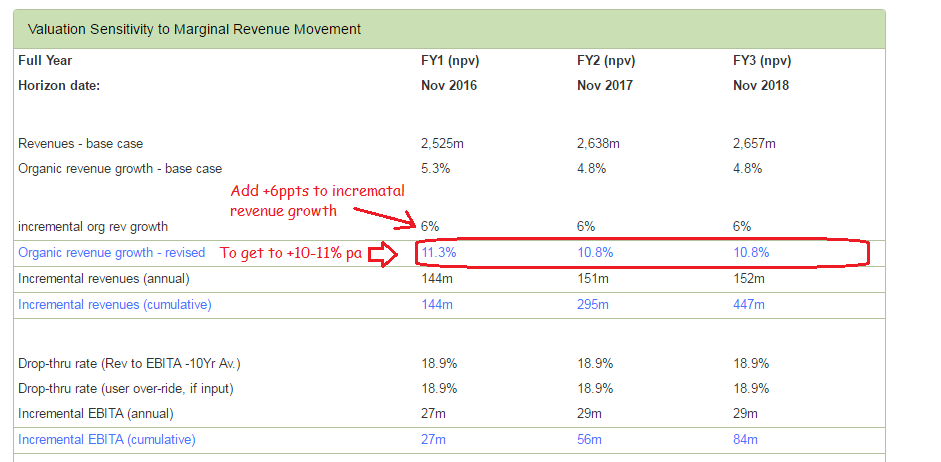
To do this, just amend the drop down option to the required adjustment to incremental revenues. In this case, that’s a +6% adjustment to keep the annual revenue growth at +10-11% pa as per the consensus. For Gartner, I’m not adjusting the marginal revenue to EBITA assumption and am happy to go with the default setting, which takes the 10 year historic average and which in this case is approx 18%.
The effect of this on the valuation would be to raise it by an average of approx +35% over the forecast period, with the NPV rising to withing 10% of the currrent share price by Yr 3. (NB, these are NPV’s).
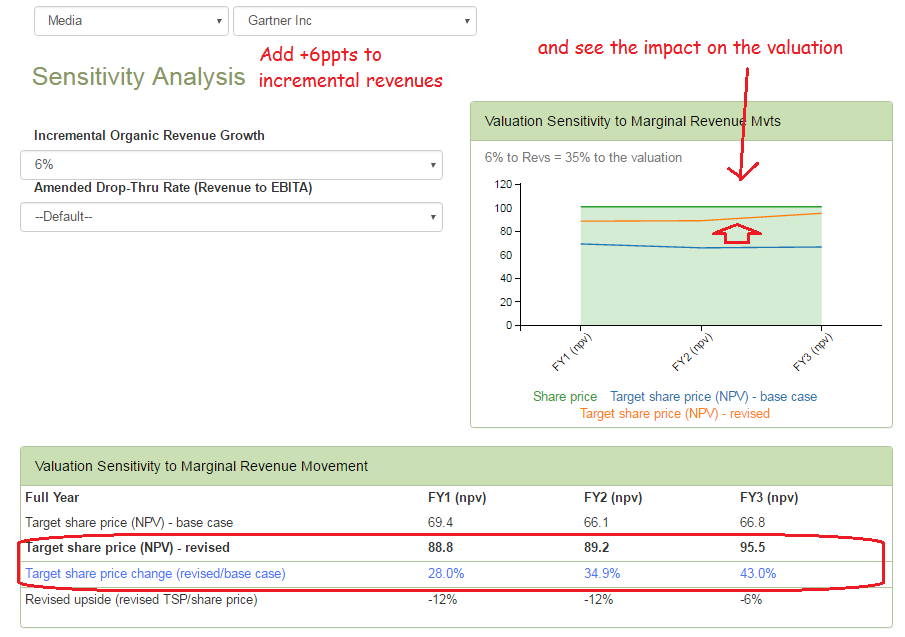
Amend the revenue growth and watch the revaluation