US employment data yet to support an early easing in monetary policy

We may be heading for a recession, but not one that is so far being flagged by current US employment or wage data. For those anticipating an early peaking of interest rates by the US Federal Reserve, that therefore might come as a disappointment, as without a more pressing evidence of an already significant cooling in employment demand, the primary focus for the US Fed will be to control the current spike in inflation and thereby defend the US dollar and its reserve currency status. Unlike previous recessions, this one is a function of rising inflation borne from reckless fiscal and monetary easing, which in turn now considerably limits the policy tools and options that were used previously to restore growth.
The Federal Reserve Act mandates that the Federal Reserve conduct monetary policy “so as to promote effectively the goals of maximum employment, stable prices, and moderate long-term interest rates”, albeit often referred to as its ‘dual mandate’ given that the last one will be broadly determined by the first two. As stable prices are a pre-requisite for both long term interest rates and ‘maximum employment’, this part of the mandate must inevitably have primacy in determining monetary policy unless one can point to some exceptional near term mitigating circumstances affecting the other two mandate objectives.
There are two principal data sources for US employment and wages that will form the basis for US administration fiscal and US Fed monetary policy, these being the Bureau of Labor statistics (BIS – compiling monthly estimates for net job additions and average wages) and the Dept of Labor (DoL – UNEMPLOYMENT INSURANCE WEEKLY CLAIMS … Initial claims). The former relies primarily on survey data and therefore is less reliable, albeit offering a broader insight by industry, while the Weekly unemployment claims data is more of a hard data point, being compiled by actual cash claims lodged against the government.
Staring with the BIS employment and wage data (below), one can see a slowing rate of net monthly job additions for the private sector, but still a positive one, at around +100k of underlying (excl changes in seasonal adjustments) net adds per month into the end of 2022. Include changes in seasonal adjustments and that rate doubles to around +200k per month. Historically, this figure would need to turn substantially negative (such as in H1 2008) to clearly signal a recession and corporate disinvestment. While this may yet happen, it is not currently in the data, thereby suggesting policy makers may be reluctant to ease of the current tightening at this stage.
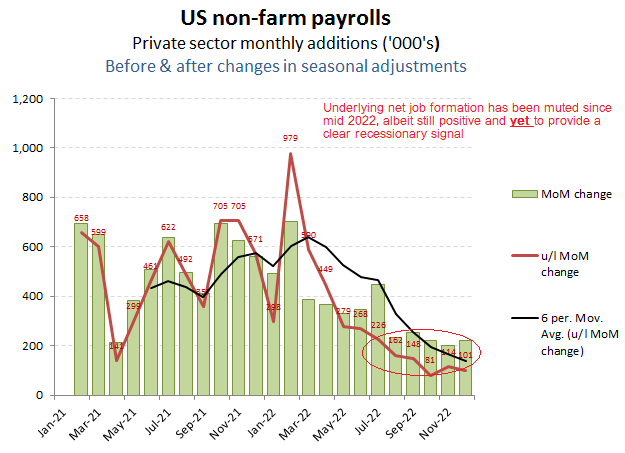
Slowing, but still growing net monthly job additions
Drill down into the employment performance by industry and one might be encouraged by the broad based strength in full time employment, with the exception of IT, which is currently undergoing a well publicised contraction following the exceptional stimulus from the CV lockdowns. The steep decline in ‘Temporary’ employment however, may provide an early warning of tougher times to come, as this category is often used as swing capacity, in that it represents the lowest level of either investment, or cost to add or remove. As employers identify less business coming the pipe, their first area to cull will therefore be amongst this group, so one will need to be alert to the possibility of this cascading into deeper cuts in capacity and full time employment should this demand trend continue.
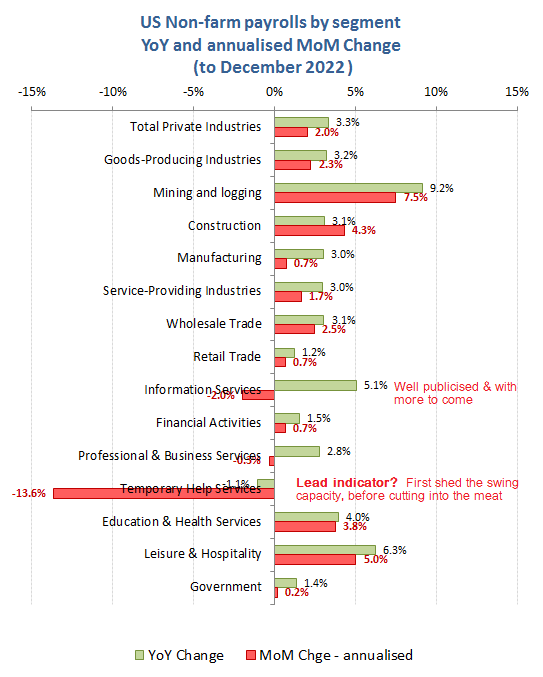
Watch for ‘canaries’!
Inflationary pressures once embedded into wage settlements can easily lead to upward inflationary spiral that can be difficult to purge. For now, the BIS data is not suggesting this is occurring, although anecdotal evidence from the current wave of industrial disputes and wage demands as food and energy prices start to impact might suggest that these may not be too for off. It does however, provide an additional incentive for the US Fed not to repeat the mistakes of Arthur Burns and to act hard and fast so as to nip this into the bud.

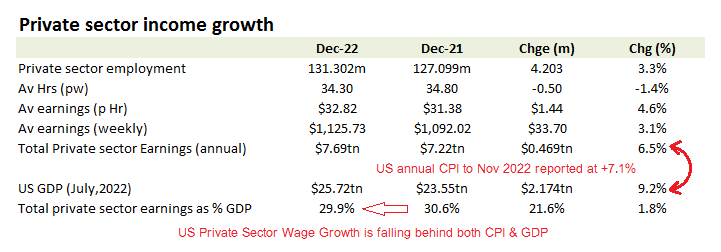
Wages yet to respond to CPI surge
Notwithstanding the slight temporal disparity between the GDP (Q3) and the December employment data, the point from the below table is that private sector earnings are already declining in real terms and as against GDP. The implications from this ought to be that should the US Fed continue to support the monetary easing that has been stoking up demand and GDP, this will inevitably filter thru into wage settlements and therefore an inflationary spiral.
If the monthly non-farm payroll numbers from the BIS (Bureau of Labor Statistics) are can often seem akin to guestimates, the weekly unemployment insurance claims data from the Dept of Labor offers a harder data series in that it reflects actual cash calls. While the distortions from CV lockdowns and government stimulus cheques make any subsequent analysis of trends loaded with caveats, one immediate conclusion for the current data is that employment markets are turning negative, but only just and remain a long way from signalling recession on past performances.
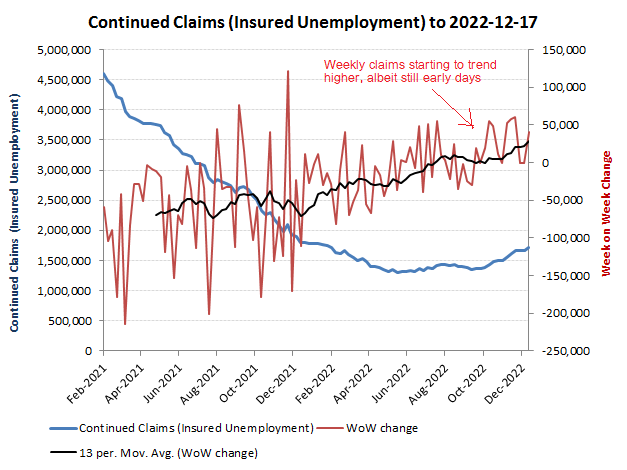
Weekly claims rising, but still modest relative to previous recent recessions
Each recession has its own dynamics, but ultimately result in a contraction in capacity and therefore employment. In early 2000’s (below), this was a fairly drawn out affair, starting with the bursting of the earlier dot.com bubble and closing with 9/11, which ultimately led to government reflation. An important point to note however, was that US CPI in 2001 was +2.8% (vs +3.4% in 2000), while Federal debt of $5.8tn was at a ‘mere 57% of GDP, thereby facilitating scope plenty of potential fiscal and monetary interventions; something perhaps now fully expended!
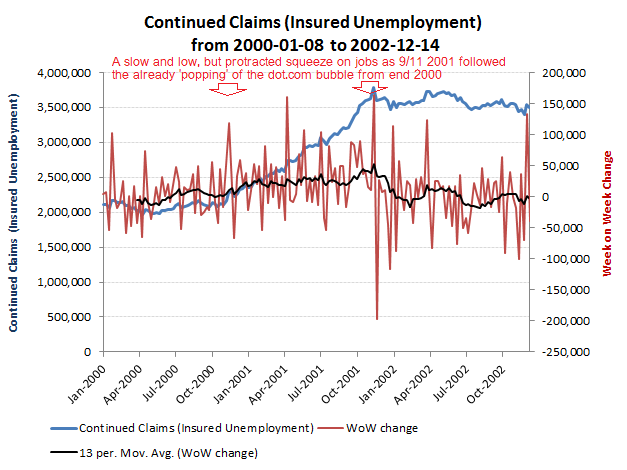
Recession in jobs post dot.com bubble was gradual, but unrelenting
New economic quackery in the form of MMT leading into and over the 2008-09 financial crisis saw the employment trends from the previous recession compressed both into the downturn (with unemployment claims hitting almost +100k per week at the trough), followed by a rapid recovery as cash was ‘helicoptered’ into the economy from money printing (QE). At this juncture, US Federal debt at end of 2008 of $9.7tn was at around 67% of GDP, rather than than at the current level of approx 120%!
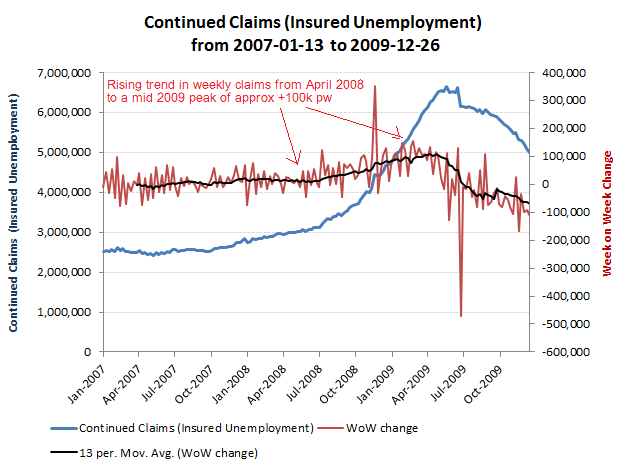
The sub-prime collapse came as a greater shock, but triggered the subsequent reflation